


Information
Documentation
Serial crystallography hit rate calculator
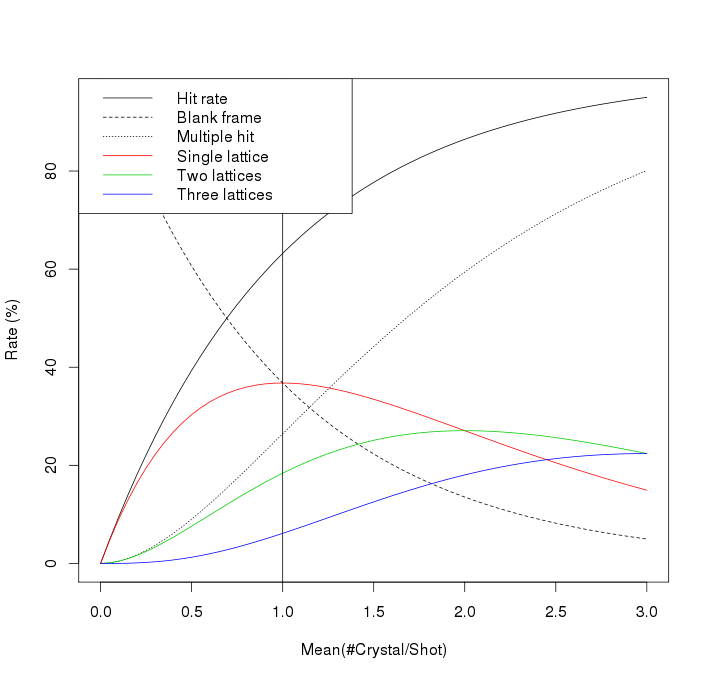
Hitrate was modeled by Poisson distribution as in [1]. The vertical line is at rate parameter = 1.
- Hunter, Mark S., et al. "Fixed-target protein serial microcrystallography with an x-ray free electron laser" Scientific reports 4 (2014).
The plot was generated by the following R code.
lambda <- seq(0, 3, by=0.05)
plot(lambda, 100 - 100* dpois(0, lambda=lambda), type='l',
     ylab="Rate (%)", xlab="Mean(#Crystal/Shot)")
lines(lambda, 100 * dpois(0, lambda=lambda), lty=2)
lines(lambda, 100 * (1 - dpois(0, lambda=lambda) - dpois(1, lambda=lambda)), lty=3)
lines(lambda, 100 * dpois(1, lambda=lambda), lty=1, col=2)
lines(lambda, 100 * dpois(2, lambda=lambda), lty=1, col=3)
lines(lambda, 100 * dpois(3, lambda=lambda), lty=1, col=4)
abline(v=1)
legend("topleft", lty=c(1, 2, 3, 1, 1, 1), col=c(1, 1, 1, 2, 3, 4),
        c("Hit rate", "Blank frame", "Multiple hit", "Single lattice",
          "Two lattices", "Three lattices"))