With the vertex detector installation in 1996 it was possible to measure the distribution of interactions along the target wires.
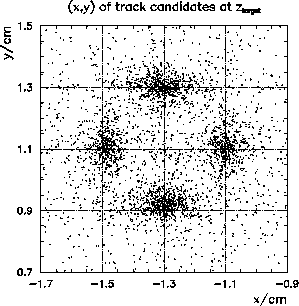
Figure 16: Target wires seen by the VDS.
Fig. 16 shows the transverse coordinates of track candidates from
the vertex detector plotted at the plane of the target wires. The clusters
corresponds to individual wires. The background is purely dominated by
combinatoric. The projection along the target wire has an rms-width around
500 ![]() m, reflecting the intrinsic distribution on the wire folded with
the vertex detector resolution of around 300
m, reflecting the intrinsic distribution on the wire folded with
the vertex detector resolution of around 300 ![]() m.
The intrinsic width is therefore equal to the beam width of around 400
m.
The intrinsic width is therefore equal to the beam width of around 400 ![]() m
and not significantly smeared out by nonlinear effects in the beam halo.
m
and not significantly smeared out by nonlinear effects in the beam halo.