Welcome to the DESY CSR benchmarking website! Please relax, have yourself a nice cup of tea, and enjoy your stay
The purpose of this website is simply to present an evaluation of CSRtrack, GPT and OCELOT for the study of CSR effects at DESY.
The Zeuthen benchmark
I wish to evaluate the use of GPT for the purposes of the EUXFEL. As with most CSR code benchmarks, this begins with the Zeuthen benchmark chicane. The chicane’s magnetic and geometric properties are as follows:
Parameter |
Symbol |
Value |
Unit |
|---|---|---|---|
Bend magnet length (projected) |
Lb |
0.5 |
m |
Drift length B1->B2 and B3->B4 (projected) |
L0 |
5.0 |
m |
Middle drift length |
Li |
1.0 |
m |
Post chicane drift |
Lf |
2.0 |
m |
Bend radius of each dipole magnet |
R |
10.35 |
m |
Bending Angle |
f |
2.77 |
° |
Momentum compaction |
R56 |
-25 |
mm |
2nd order momentum compaction |
T566 |
+37.5 |
mm |
Total projected length of chicane |
Ltot |
13.0 |
m |
Vertical half gap of bends |
g |
2.5, 5 |
mm |
The beam parameters are shown in the following table.
Parameter |
Symbol |
Value |
Unit |
|---|---|---|---|
Nominal energy |
E0 |
5.0 |
GeV |
Flat top current after compression |
Q |
6 |
kA |
Modulation wavelength after compression |
l |
0.5, 1, 2, 5 |
um |
Relative modulation depth before compression |
h |
1E-3 |
|
Uncorrelated relative energy spread before compression |
(DE/E0)u-rms |
0,4*10E-5 |
|
Linear energy-z correlation |
a |
+36 |
m-1 |
initial normalised rms emittance |
εx, εy |
0,1,10/1 |
mm·mrad |
initial betatron functions at 1st bend entrance |
βx / βy |
40/13 |
m |
initial alpha-function at 1st bend entrance |
αx / αy |
2.6/1.0 |
The primary distribution used for the benchmark is shown in Fig. 1. The spurious increase in the slice energy spread at the tails of the distribution is due to the fact that the slices are determined by accumulating along the bunch a fixed number of macroparticles per slice. That is to say the slices vary in length. At the head and tail of the beam, both of which are underpopulated, the slices are longer and are dominated by the longitudinal chirp. For consistency the same distribution for any given simulation scenario is used across all the codes under consideration. In general the GPT primary distribution generator is used and then converted to CSRTrack (fmt1 ASCII) and OCELOT (using easygdf). However, as CSRTrack is hardcoded to support a maximum of 2.5 million macroparticles, the CSRTrack simulations may use a random subset of the GPT-generated input distribution where the number of macroparticles used in the GPT simulation exceeds 2.5M (no such constraint exists in OCELOT). The initial distribution is drifted back by 10cm in GPT to ensure no overlap with the fringe fields. In OCELOT this corresponds to an initial drift element of 10cm placed before the first chicane dipole.
Fig. 1 The initial distribution for the simulation of the Zeuthen benchmark chicane, 8 million macroparticles.
Optical tracking comparison
First I ran the codes without any collective effects to ensure the simulations are all configured correctly and to identify any differences in the optical tracking between the codes. Fig. 2 shows the distributions 2m after the last chicane dipole from the three codes under consideration. The compression to 6kA is achieved in all three, confirming that the lattice and beam descriptions are configured correctly. All three codes differ slightly in the final compression, with CSRTrack showing the greatest compression. This is most likely due to differences in the integration methods used between the three codes. OCELOT uses second order transfer maps whereas both CSRTrack and OCELOT integrate the equations of motion numerically. Regardless, the maximum difference in the compression between the codes is 0.75%, which is negligible for the purposes of these simulations.
One additional difference between the codes involves the fringe fields. GPT uses Enge functions for a smooth longitudinal fall-off in the magnetic field whereas the results generated using OCELOT and CSRTrack featured no fringe fields at all. To examine the potential impact of the fringe fields, I ran GPT without them. However this resulted in a difference in the final peak current of just a single amp, and therefore any impact of the fringe fields can be considered negligible. GPT runs faster with fringe fields switched on and for this reason were left on for all subsequent simulations.
Fig. 2 The resulting macroparticle distributions 2m after the last chicane dipole of the Zeuthen benchmark chicane.
CSR effects, 1D CSRTrack and GPT’s radiative-only model
Next the Zeuthen benchmark was run in all three codes with CSR switched on. CSRTrack is
run with the 1D projected model, which is similar to the one used in OCELOT. The
settings used are shown below. The tracking settings are reused as typical “sensible”
options. The choice of relative_long ensures that the longitudinal current
smoothing is sufficiently small to resolve details but not too small as to feature
artificial microbunching. A choice equal to one tenth of the final bunch length was
used consistently to generate the CSRTrack results presented here.
!---------------------------------------------------
! force definition
!---------------------------------------------------
forces{type=projected
       sigma_long=relative
       relative_long=0.1
      }

!---------------------------------------------------
! tracking
!---------------------------------------------------
  track_step{precondition=yes
             iterative=2
             error_per_ct=0.001
             error_weight_momentum=0.0

             ct_step_min=0.02
             ct_step_max=0.10
             ct_step_first=0.10
             increase_factor=1.5
             arc_factor=0.3
             duty_steps=yes
            }
In OCELOT, the unit step was chosen based on the result of a convergence test (the minimum value below which the results do not change), with the same motivation for the choice of sigma_long as for CSRTrack (omitting the beam, lattice definition and IO):
navi = Navigator(...)
navi.unit_step = 0.1

csr = CSR()
csr.step = 2
csr.n_bin = 100
csr.sigma_min = final_bunch_length / 10.0
csr.traj_step = 0.0005
csr.apply_step = 0.005
CSRTrack has considerably fewer configurable settings, with the following simply disabling the Coulomb term of the Liénard-Wiechert potential (i.e. only the radiative CSR effect is present) and setting the tracking accuracy, which was provided by the authors of GPT and left unchanged (again omitting the beam, lattice definition and IO):
csr1d("NoCoulomb");
accuracy(6);
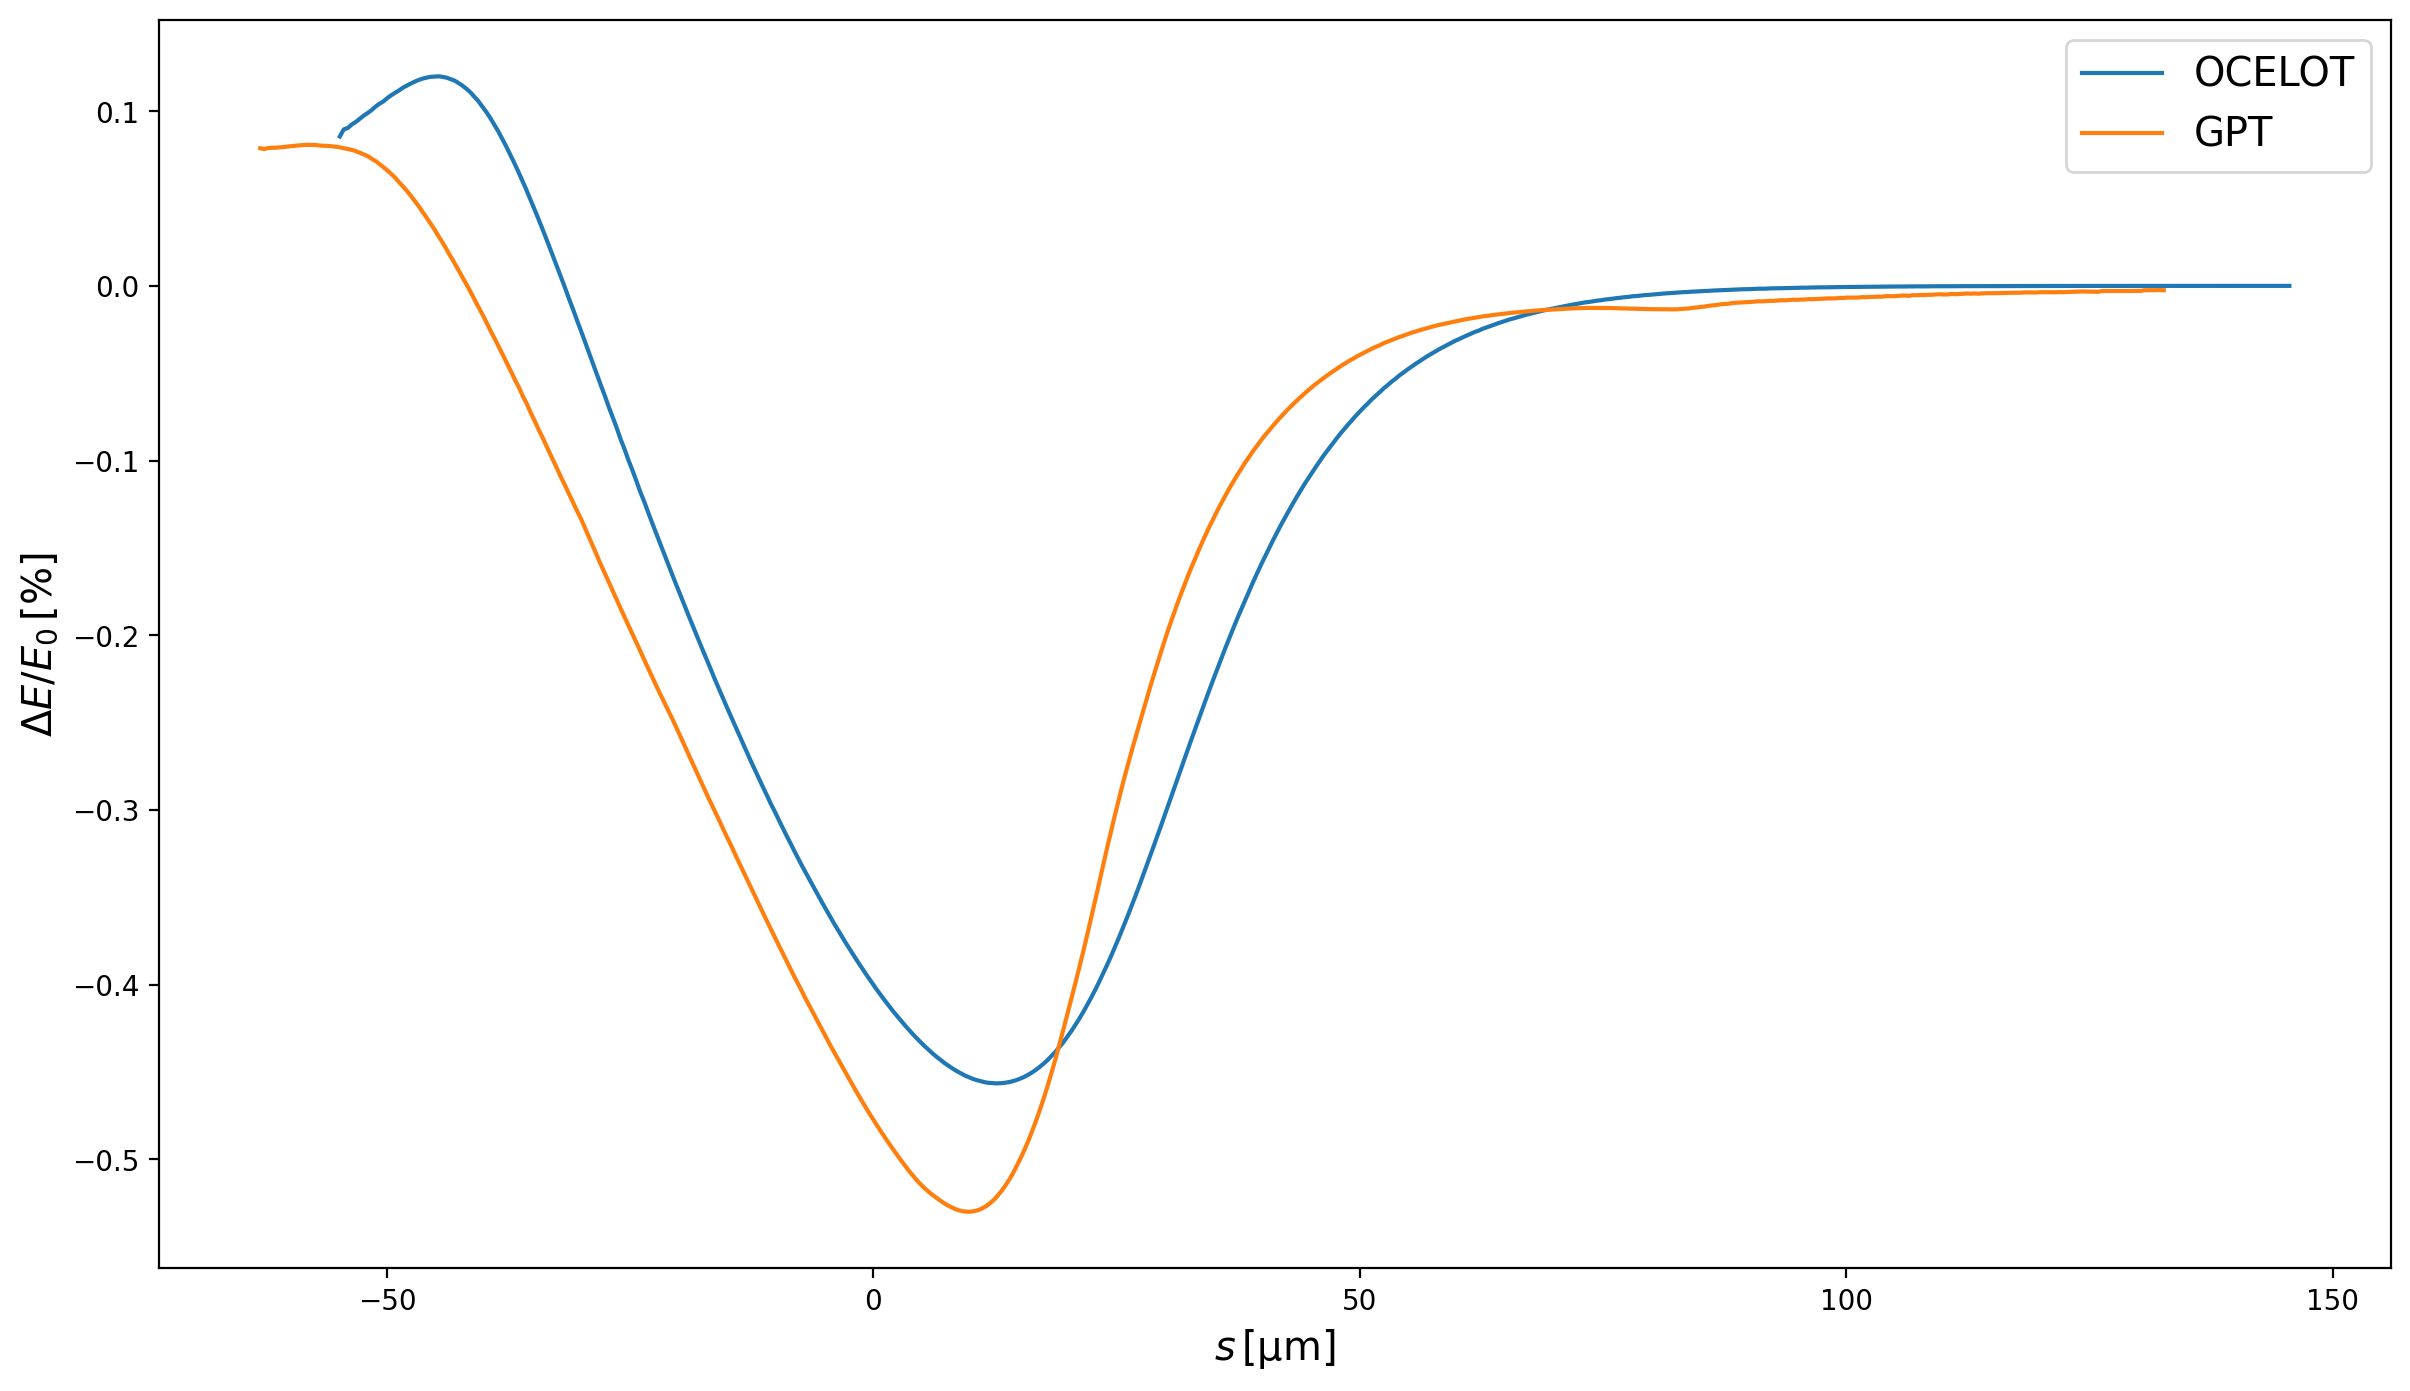
A three-way comparison of the results are shown in Fig. 3. A number of features are immediately apparent, the slice emittances are overwhelmingly preserved (except the tails of the GPT simulations, which are artefacts stemming from the moving-window employed used to calculate the slice properties). Despite this, the projected emittances in all three codes are increased by a factor on the order of 50%. This suggests that the emittance growth is entirely stemming from shifted slice positions as opposed to longitudinal mixing. Furthermore the slice offsets in the GPT simulation are considerably larger, suggesting a larger CSR wake in GPT.
Fig. 3 A comparison between OCELOT, CSRTrack 1D and GPT (radiative effect only) 2m after the last dipole of the Zeuthen chicane.
CSR effects, 2D CSRTrack and GPT’s radiative-only model
The validity of a 1D model can be encapsulated with the Derbenev Criterion,

If this inequality holds then the 1D approximation is valid. The Derbenev Criterion for the dipoles of the Zeuthen chicane is shown in Fig. 4. The 1D approximation holds in the outer dipoles and more or less in the second, but clearly is violated in the third dipole. This suggests the necessity of a 3D CSR model to adequately simulate CSR effects adequately in the benchmark chicane.
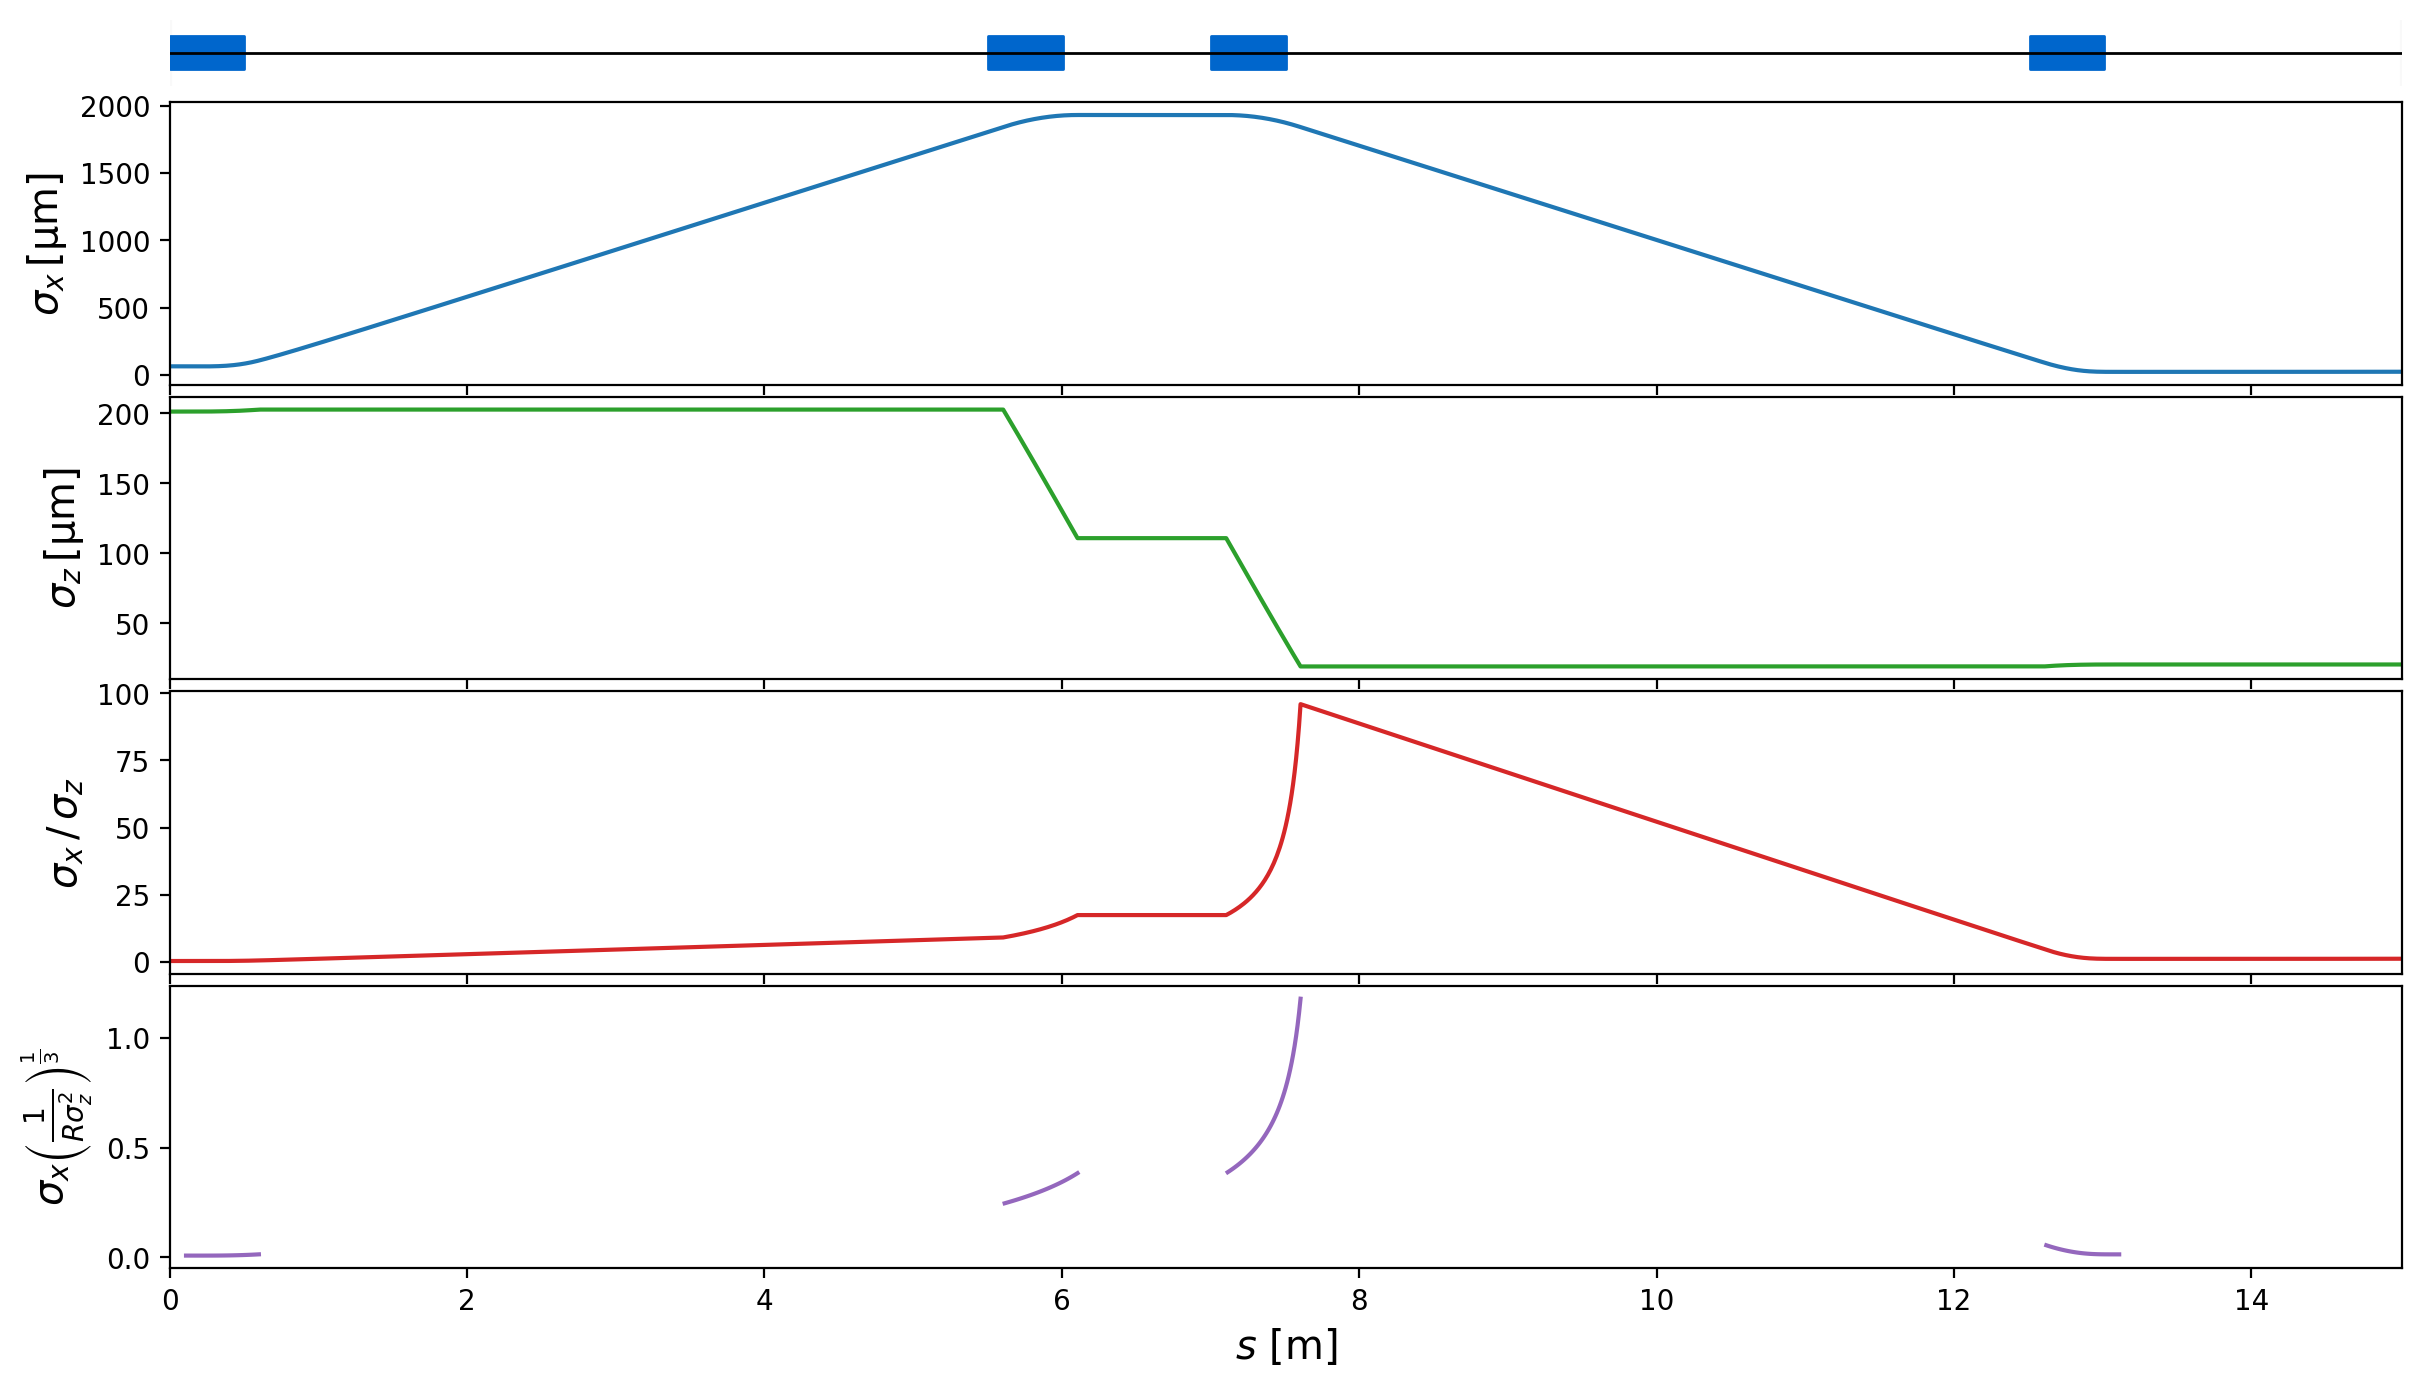
Fig. 4 The longitudinal and horizontal bunch dimensions, their ratios and the resulting Derbenev Criterion along the length of the Zeuthen benchmark chicane with the nominal beam parameters. The coefficient must be much less than 1 for the 1D approximation to hold.
GPT and CSRTrack both simulate 3D effects, albeit with different techniques. To
compare the two, the 3D CSRTrack model was configured with the following settings,
with the choices of the three sigma settings chosen to be one tenth of the
final value (longitudinal) and minimum values (transverse).
forces{type=csr_g_to_m
       shape=ellipsoid
       sigma_long=2.052373674691982e-06
       sigma_rad=2.301246874223534e-06
       sigma_vert=2.4965982902896e-06
      }
The results of the 3D CSRTrack simulation in comparison with GPT and OCELOT are
shown in Fig. 5 . In relation to the effect of 1D CSR, shown in
Fig. 3, the transverse emittance differs by only 0.01 mm·mrad, which may itself be due to the reduced number of macroparticles required for the
much slower csr_g_to_m model (2.5M → 0.5m). For this reason it can be
taken that 2D effects are not important for the Zeuthen chicane, possibly due to
the general robustness of the 1D solution even when the criterion is violated, and
also that it is only violated for a small region of the chicane.
Fig. 5 A comparison between OCELOT, CSRTrack 2D and GPT (radiative effect only) 2m after the last dipole of the Zeuthen chicane.
To further understand where the origins of the different features in the slice positions in Fig. 3 and Fig. 5, it is useful to look at the net normalised energy loss at the end of the chicane for the different codes. This is shown in Fig. 6. It is clear then that the unique longitudinal modulation of the slice positions comes from the idiosyncratic net wake. Furthermore, GPT can be seen to have the largest wake of the four models considered. It is remarkable that the total energy change is inversely correlated with the final projected emittance. Comparing Fig. 6 with Fig. 3 and Fig. 5, the models with the wakes in ascending order are OCELOT, CSRTrack 1D, CSRTrack 2D and finally GPT—this is the exact opposite order of the final projected emittances for the codes. A larger wake seemingly resulting in a lower projected emittance is contrary to expectations.
Regardless, the origin of the peculiar net longitudinal wake in GPT, and why it does not go to zero in the tail is not understood. The slippage length (the difference between the arc and the chord of the bunch trajectory) is 48μm for the 2.77° dipole of the Zeuthen chicane. This means that radiation emitted at a given point in the bunch at the entrance will interact with the next 48μm by the time the bunch reaches the dipole exit.
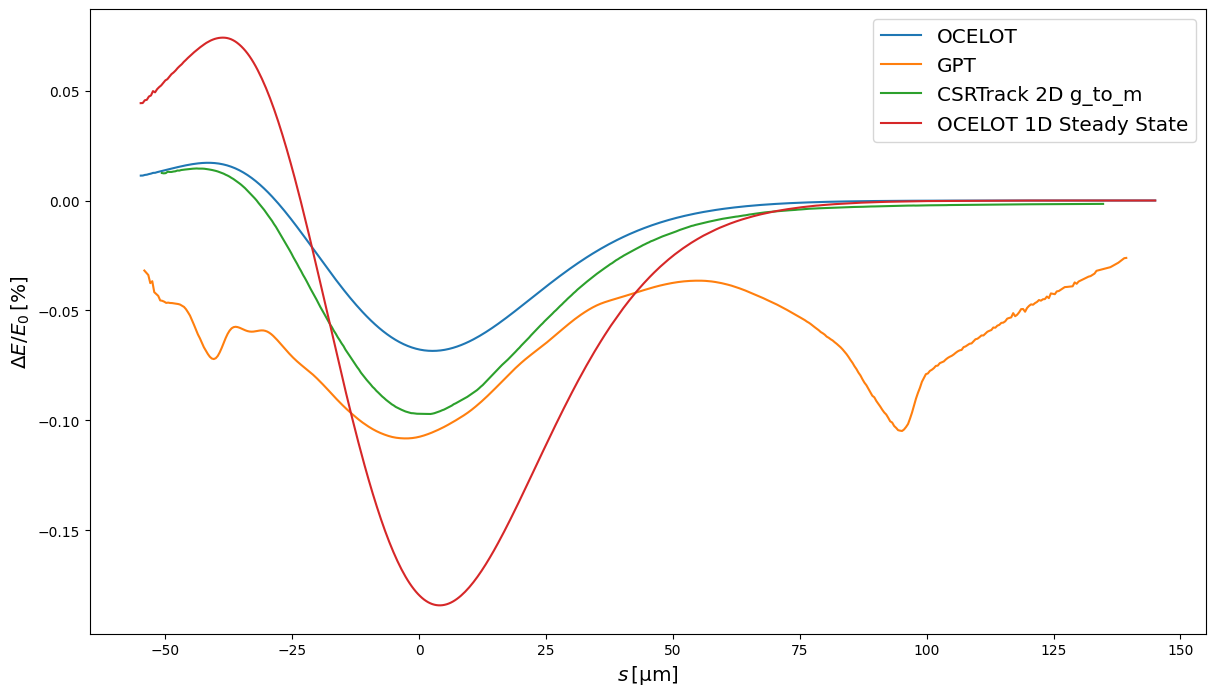
Fig. 6 Slice net mean normalised energy change for OCELOT, GPT, CSRTrack 1D and 2D, simulating 8M, 8M, 2.5M and 0.5M macroparticles, respectively. The slices here are fixed in length (as opposed to fixed in macroparticle count) to ensure that the tails are shown correctly and not smoothed out.
The effect of the CSR wake can be seen in Fig. 7. The transverse modulation in the longitudinal tails absent from CSRTrack and OCELOT is clearly apparent in GPT, and whilst clearly this region of the beam is relatively underpopulated, it is nevertheless clearly a real effect.
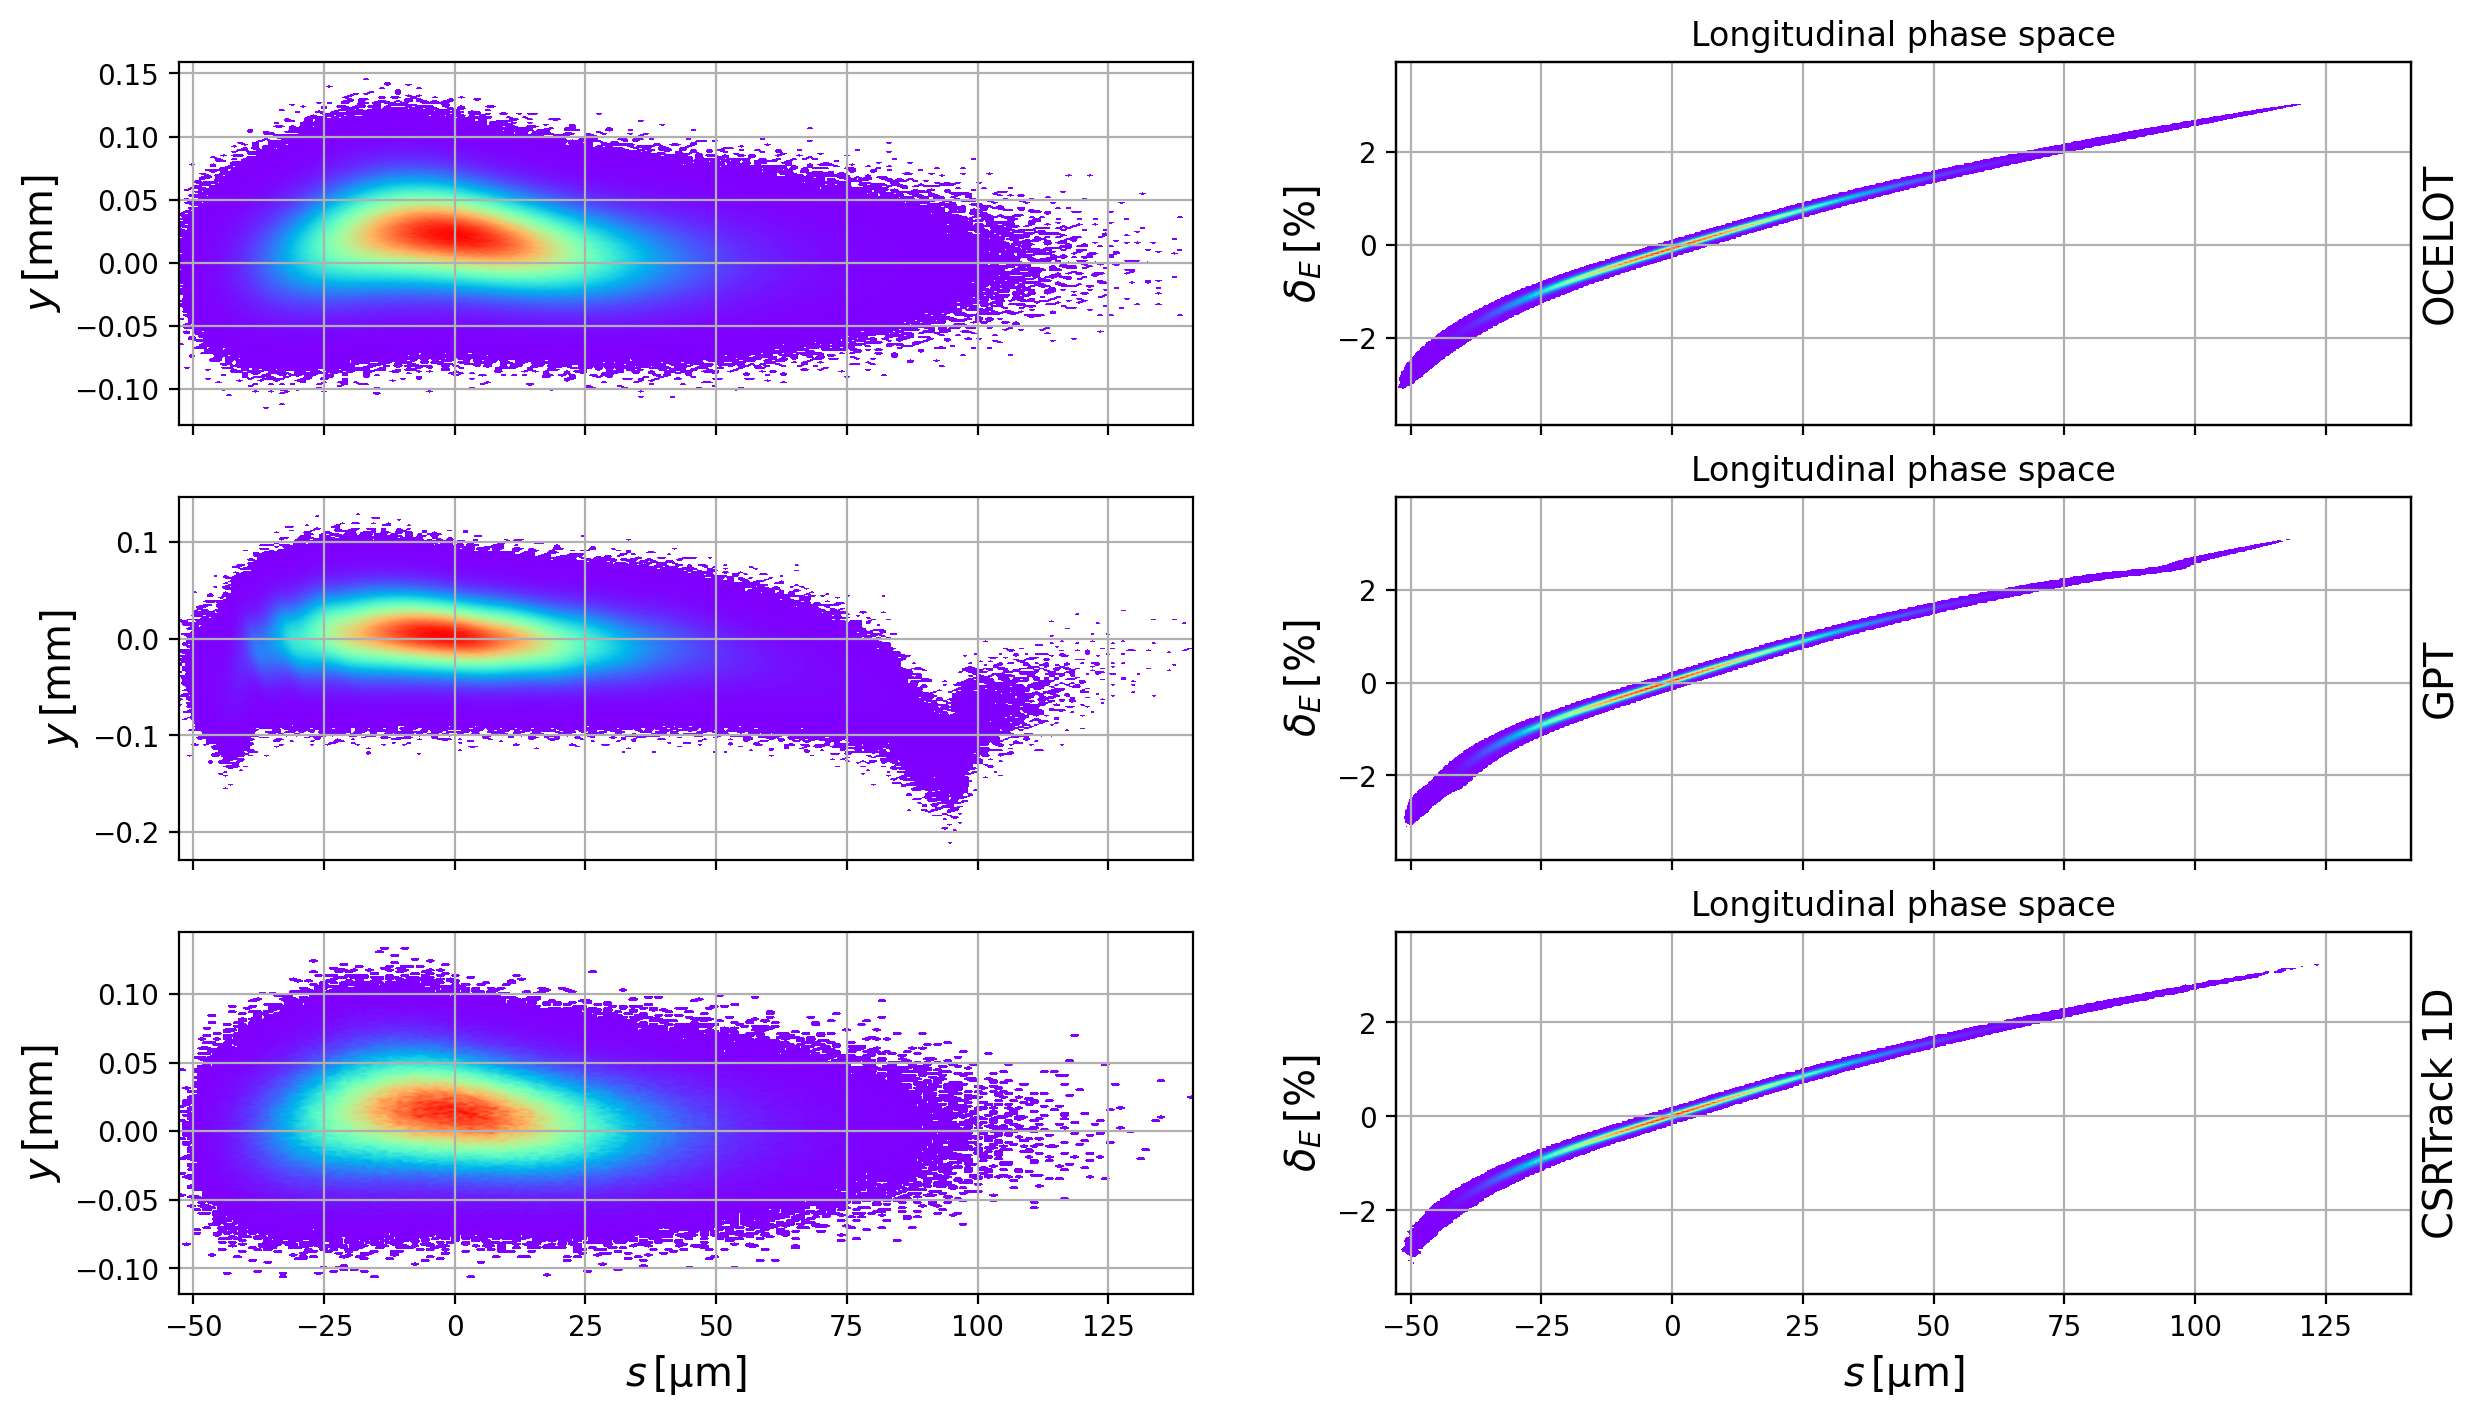
Fig. 7 Vertical and longitudinal phase spaces for OCELOT, GPT, and CSRTrack 1D simulating 8M, 8M, 2.5M and 0.5M macroparticles, respectively.
The impact of the bunch energy
To examine the impact of the beam energy, the Zeuthen benchmark was rerun with a reduced beam energy of 0.5GeV from 5GeV.
Fig. 8 Phase space comparisons for OCELOT, GPT and CSRTrack 1D at a bunch energy of 500MeV simulating 8M, 8M, 2.5M and 0.5M macroparticles, respectively.
The slice emittance in GPT decreases in the middle of the bunch (corresponding to the location of the current spike) which is conspicuously absent in OCELOT and CSRTrack. To further understand this, the bunch energy was scanned from 130MeV up to 5GeV in GPT. The slice emittances are shown in Fig. 9. Firstly the energy dependence of the emittance on the central slices (where the current spike is located) is immediately clear. In general lower energies see greater decreases in the slice emittance, until at 130MeV, where the slice emittance is instead higher and shows a sinusoidal longitudinal modulation. In this case the bunch is compressed to 17kA, which is incorrect, whereas all the rest are correctly compressed to 6kA. However, it is of course true that to exclude the Coulomb term of the Liénard-Wiechert potential at 130MeV is generally erroneous anyway, which is the case here.
Next one can see at the tails two different effects. The general trend apparently is that the slice emittance in the tails is larger for larger beam energies. For the largest beam energies (2.5 GeV and 5 GeV) the tail slice emittance diverges considerably. However it should be stated that the tail of the bunch is very sparsely populated so that regardless of its correctness, it is not necessarily important in and of itself. Conversely, in the head of the bunch, smaller energies see larger emittance growths.
Fig. 9 Slice emittances at the end of the Zeuthen benchmark chicane in GPT using just the radiative term (no Coulomb) of the Liénard-Wiechert potential for a range of beam energies. The projected emittances for the different energies are shown in Fig. 10, and the net slice energy change for the 500MeV case is shown in Fig. 11.
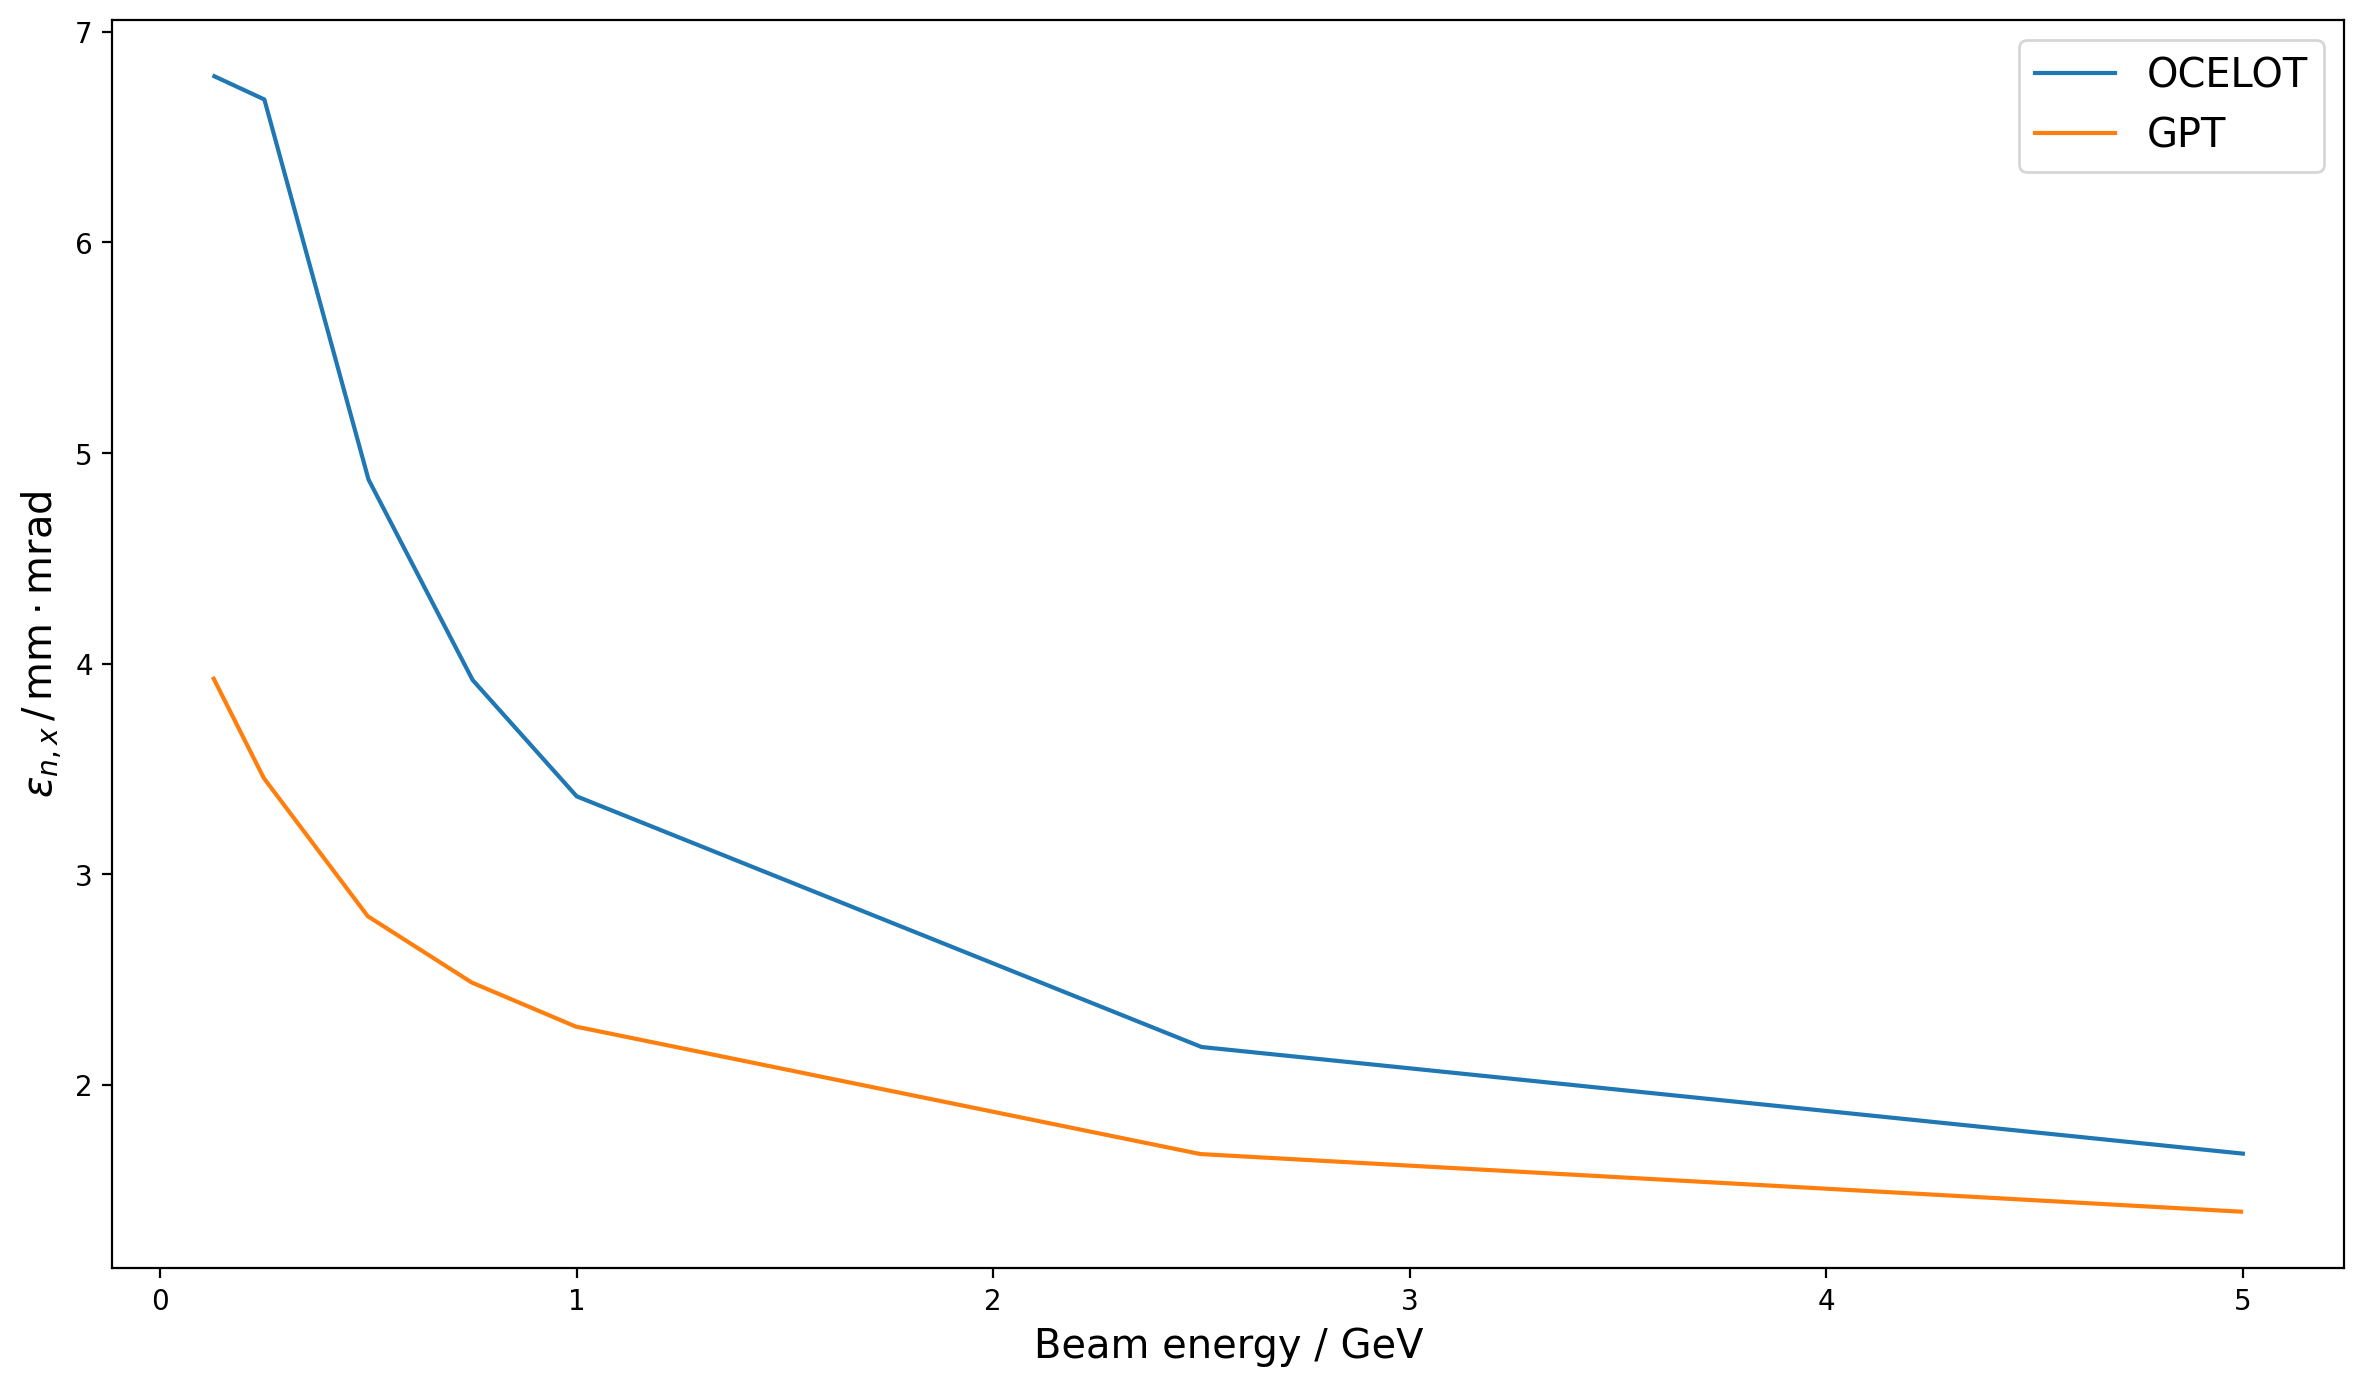
Fig. 10 The projected emittances at the end of the Zeuthen benchmark chicane for a range of bunch energies (simulated using only the radiative term of the Liénard-Wiechert potential in GPT).
The Coulomb term
In the previous section the impact of the bunch energy was examined. The
noCoulomb setting in GPT was used meaning that only the radiative term of the
Liénard-Wiechert potential is included. At lower energies, this term will matter more, so any spurious
results at lower energies are not necessarily incorrect as it may simply be
necessary to include both terms of the potential. The slice and projected
emittances for a range of energies with and without space charge are shown in
Fig. 12 and
Fig. 13, respectively.
The slice emittances are more or less untouched by the inclusion of space charge,
but the effect of space charge on the projected emittance at lower energies is on
the order of 30%. At lower energies this difference will be even greater,
but results at lower lower energies were not available as they did not terminate
in a reasonable time (120 core days, in contrast to a few hundred core hours for
those that terminated). That GPT does not necessarily terminate in a reasonable
time in some circumstances when run with the Coulomb term for CSR studies is a
known feature.
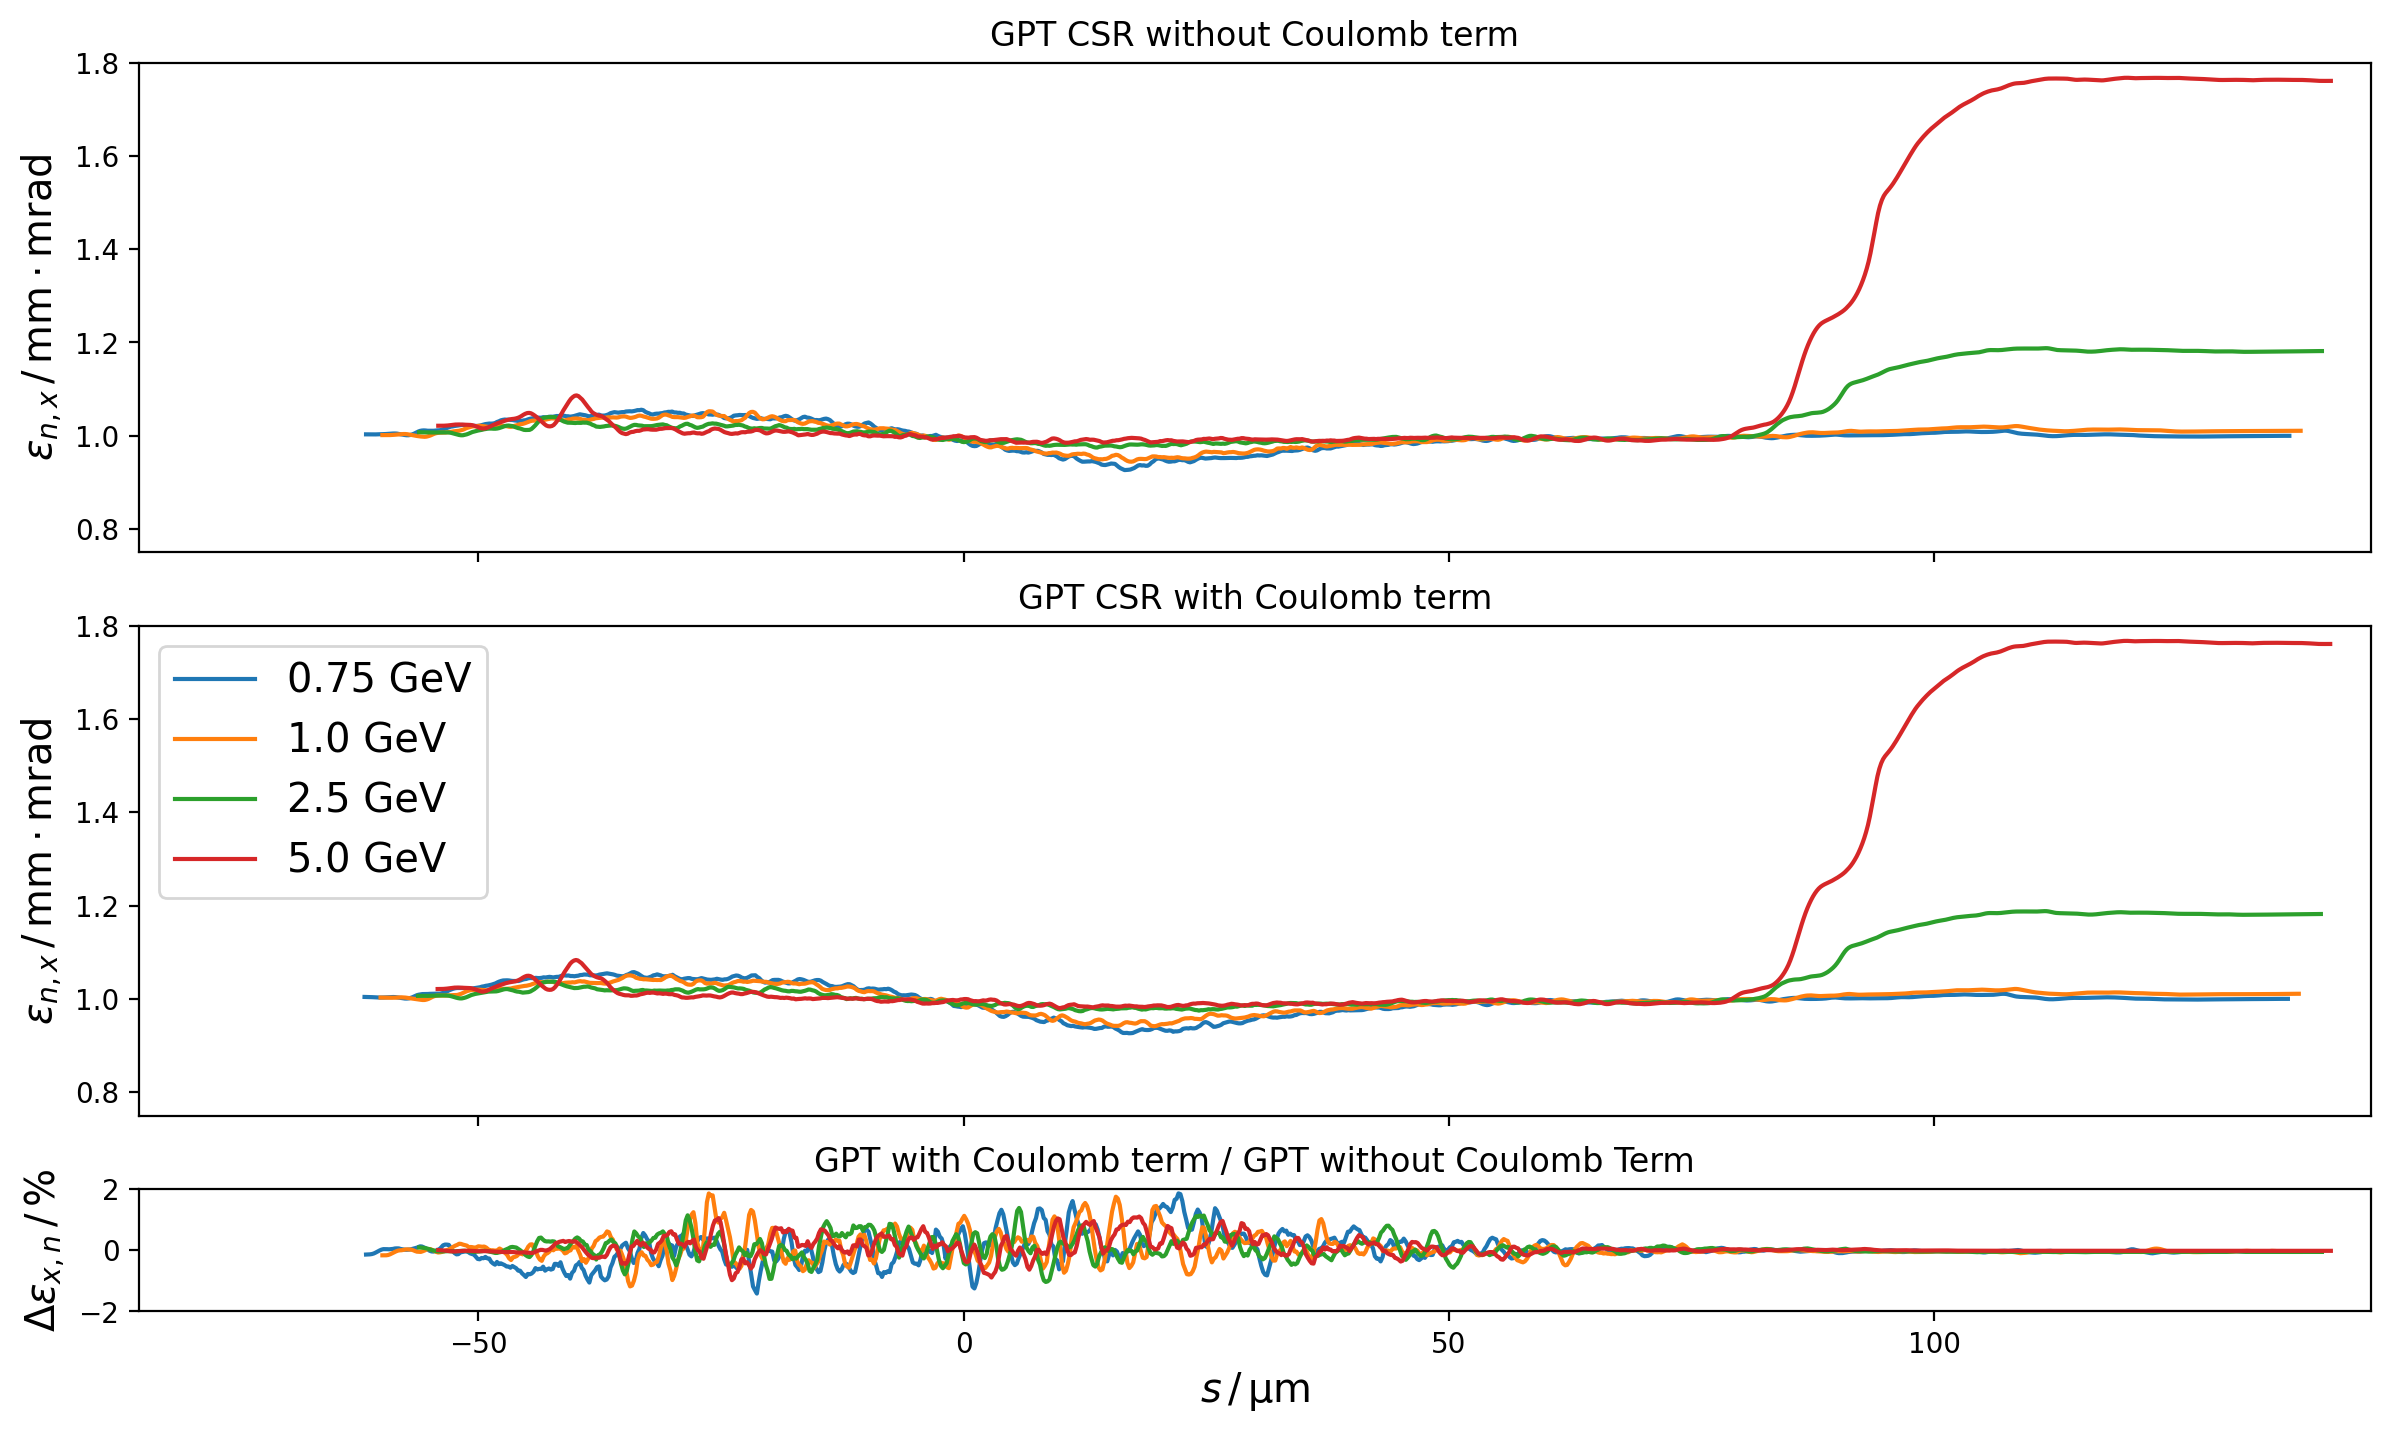
Fig. 12 Slice emittances at the end of the Zeuthen benchmark chicane in GPT with and without the Coulomb term of the Liénard-Wiechert potential for a range of energies.
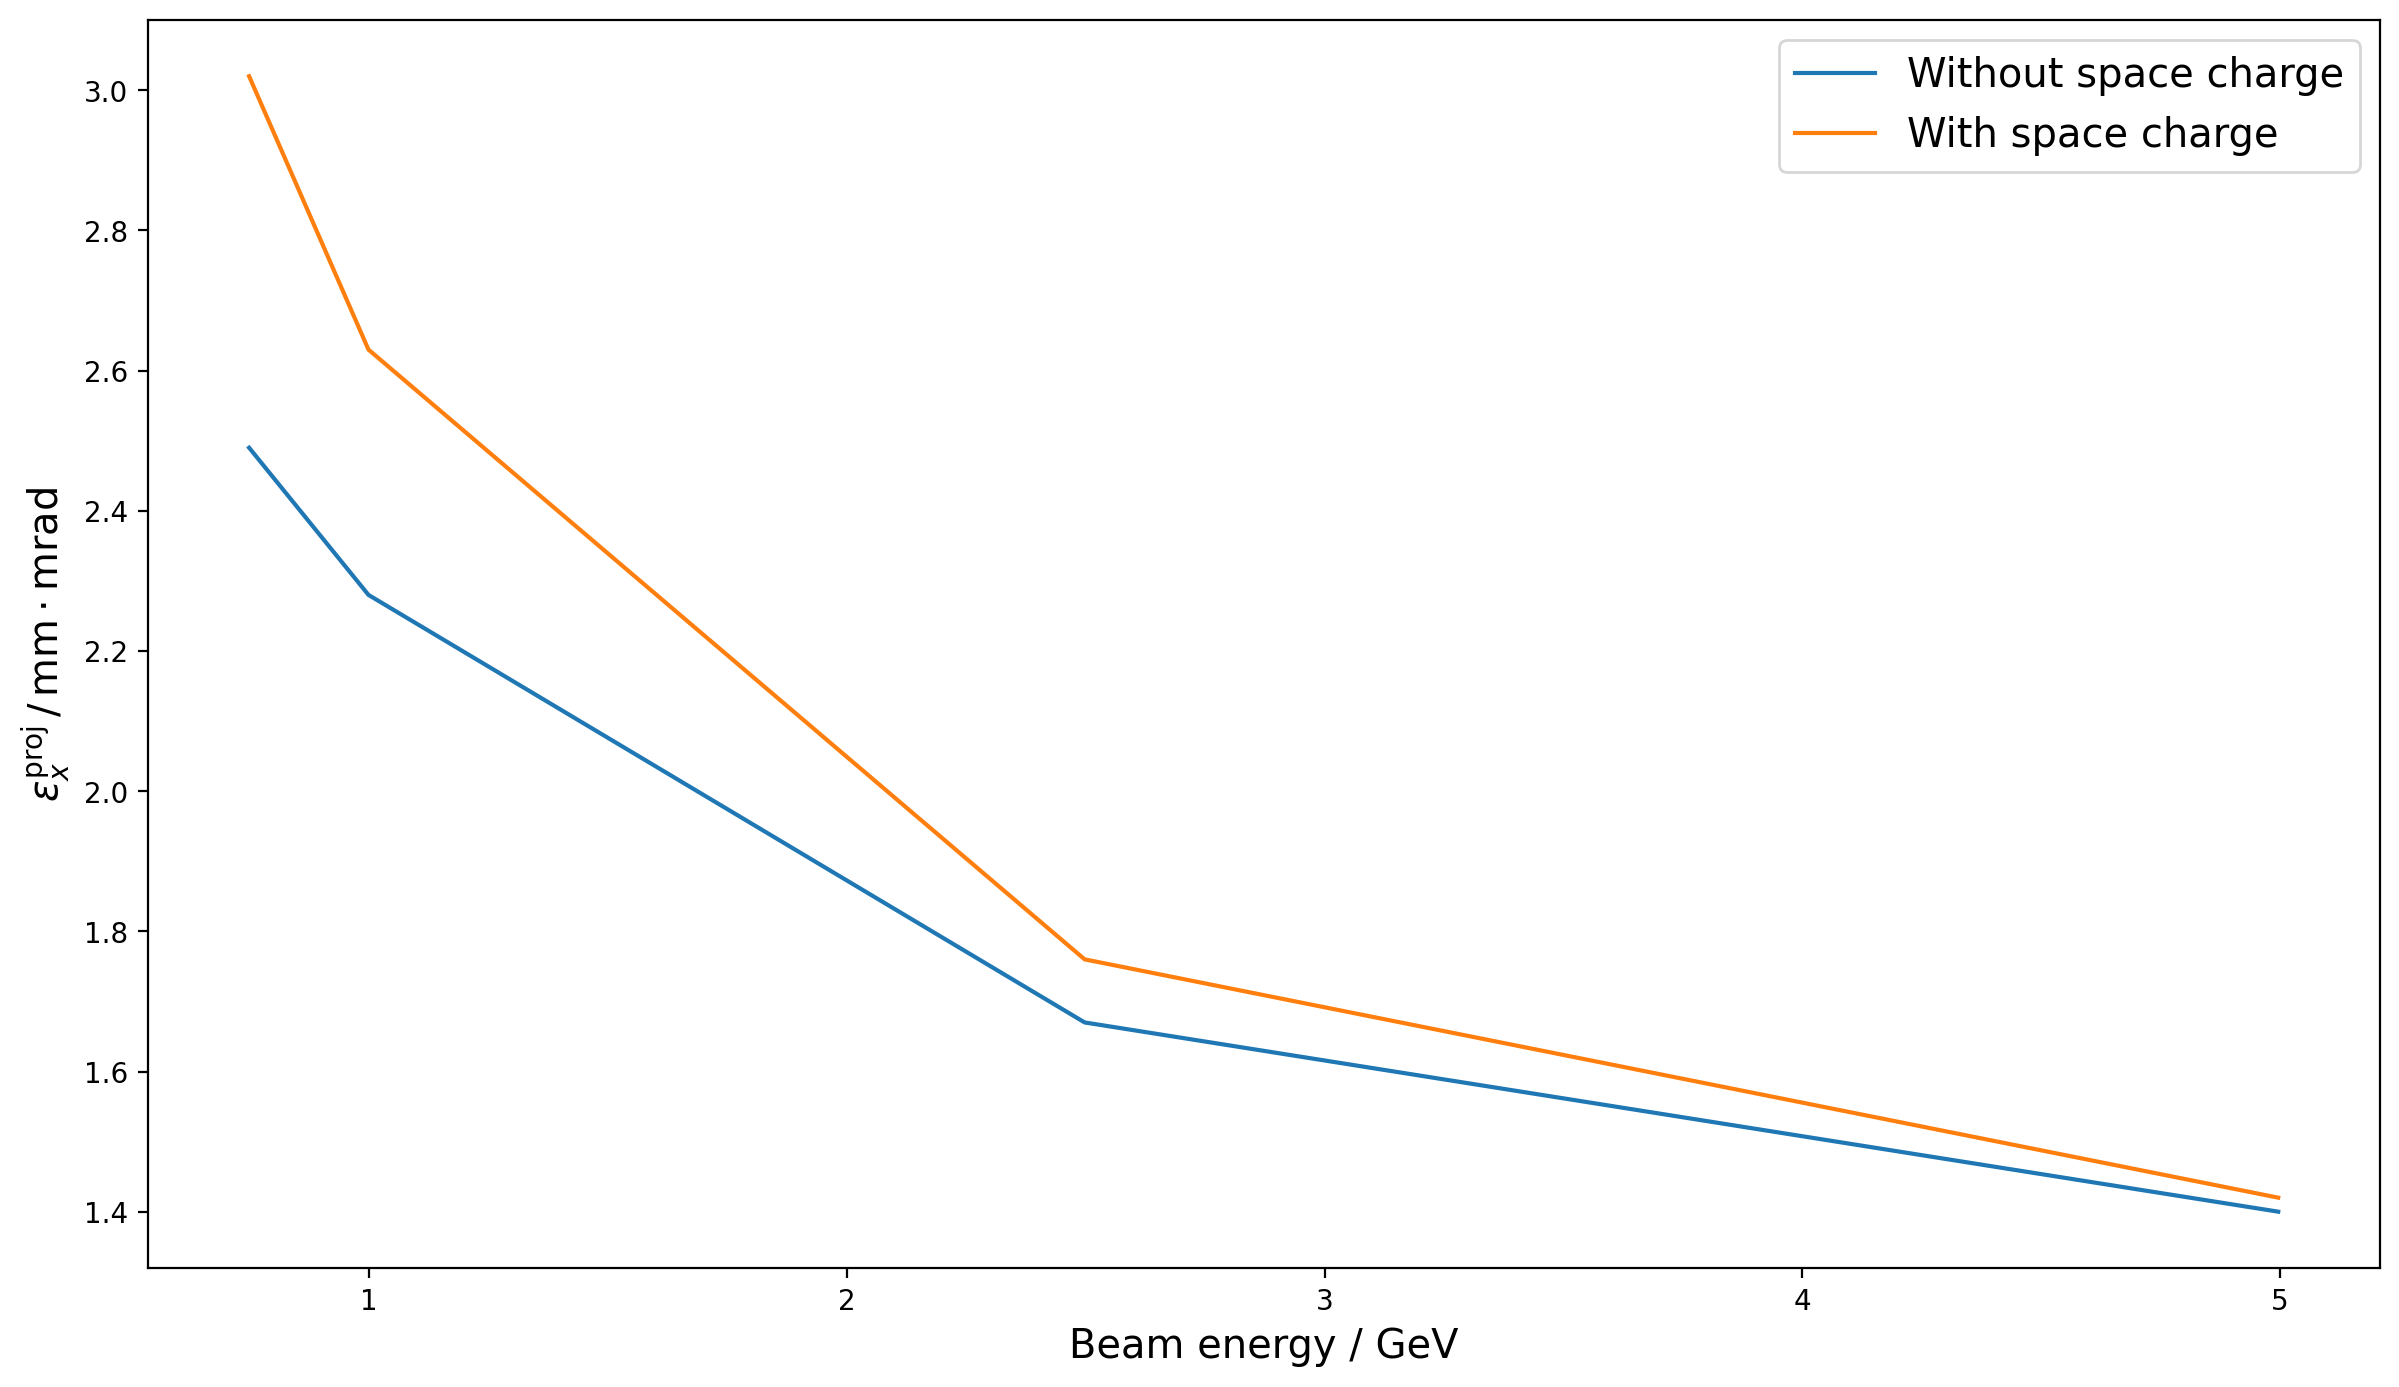
Fig. 13 The final projected emittance at the end of the Zeuthen benchmark chicane for four different beam energies in GPT, with and without the Coulomb term of the Liénard-Wiechert potential.
Reduced bunch charge
The Zeuthen benchmark at nominal settings has a bunch energy of 5GeV and a bunch charge of 1nC, both of which are well beyond what is currently seen in the bunch compressors at the EUXFEL. The bunch energy was scanned at a reduced charge and is shown below.
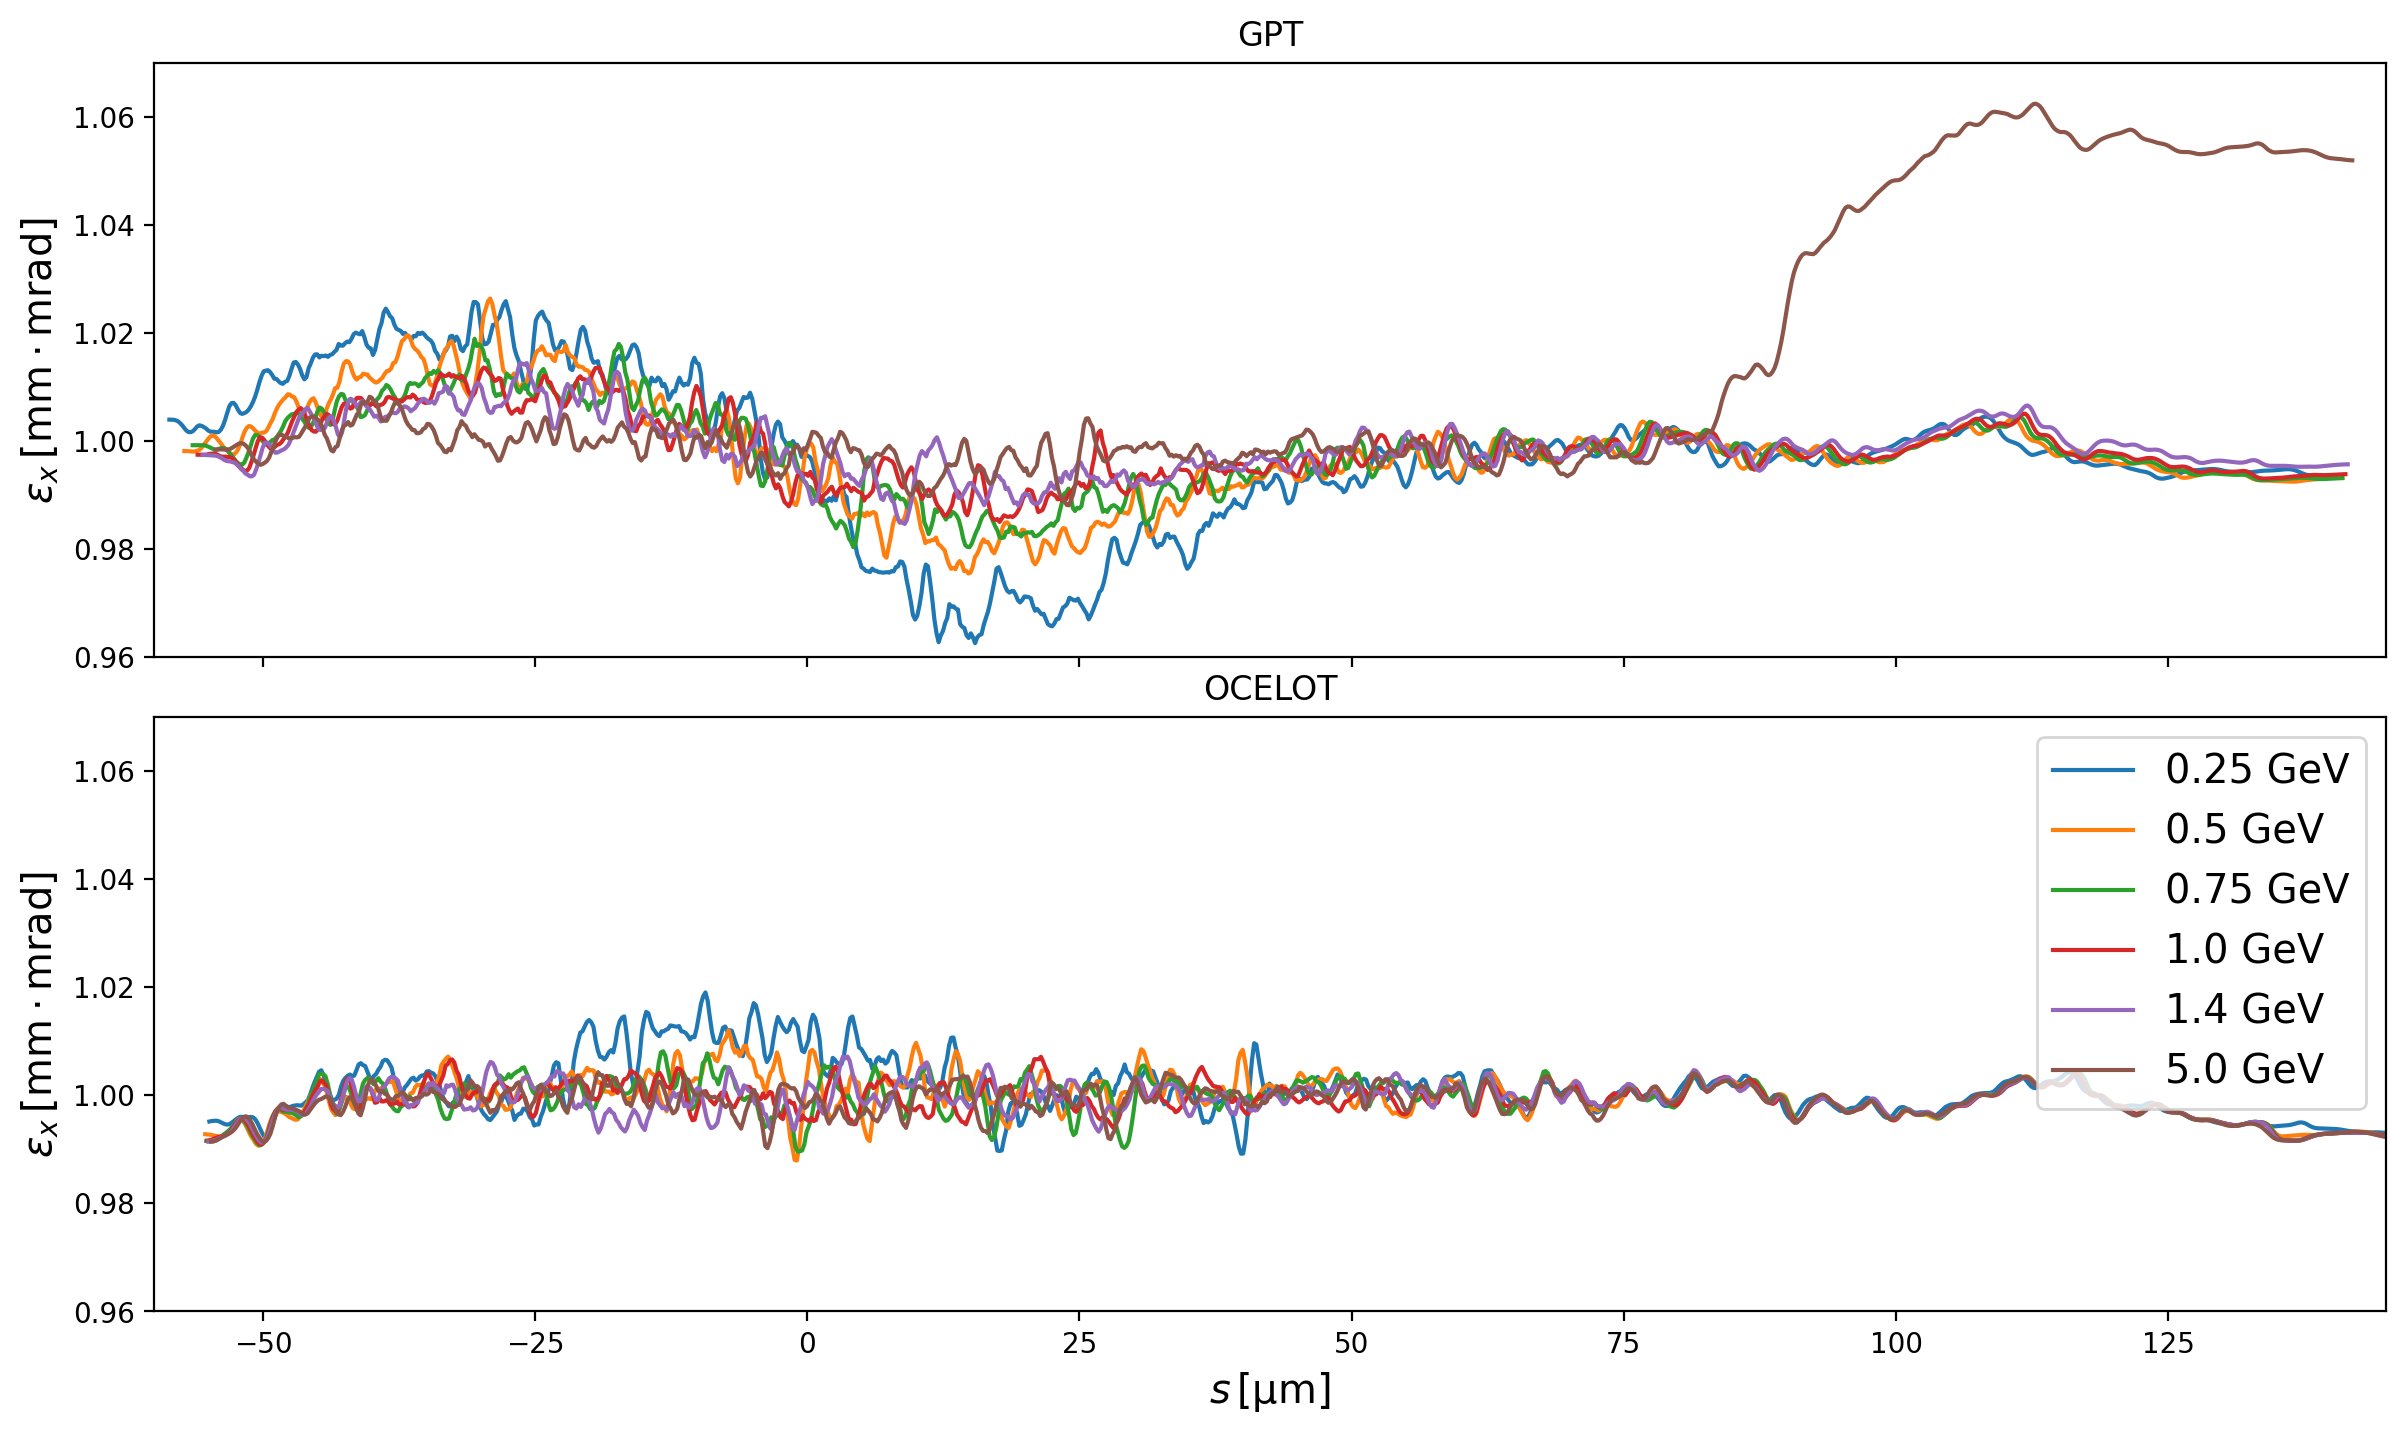
Fig. 14 Slice emittances at the end of the Zeuthen benchmark chicane in GPT using just the radiative term (no Coulomb) of the Liénard-Wiechert potential for a range of beam energies at a bunch charge of 250pC.
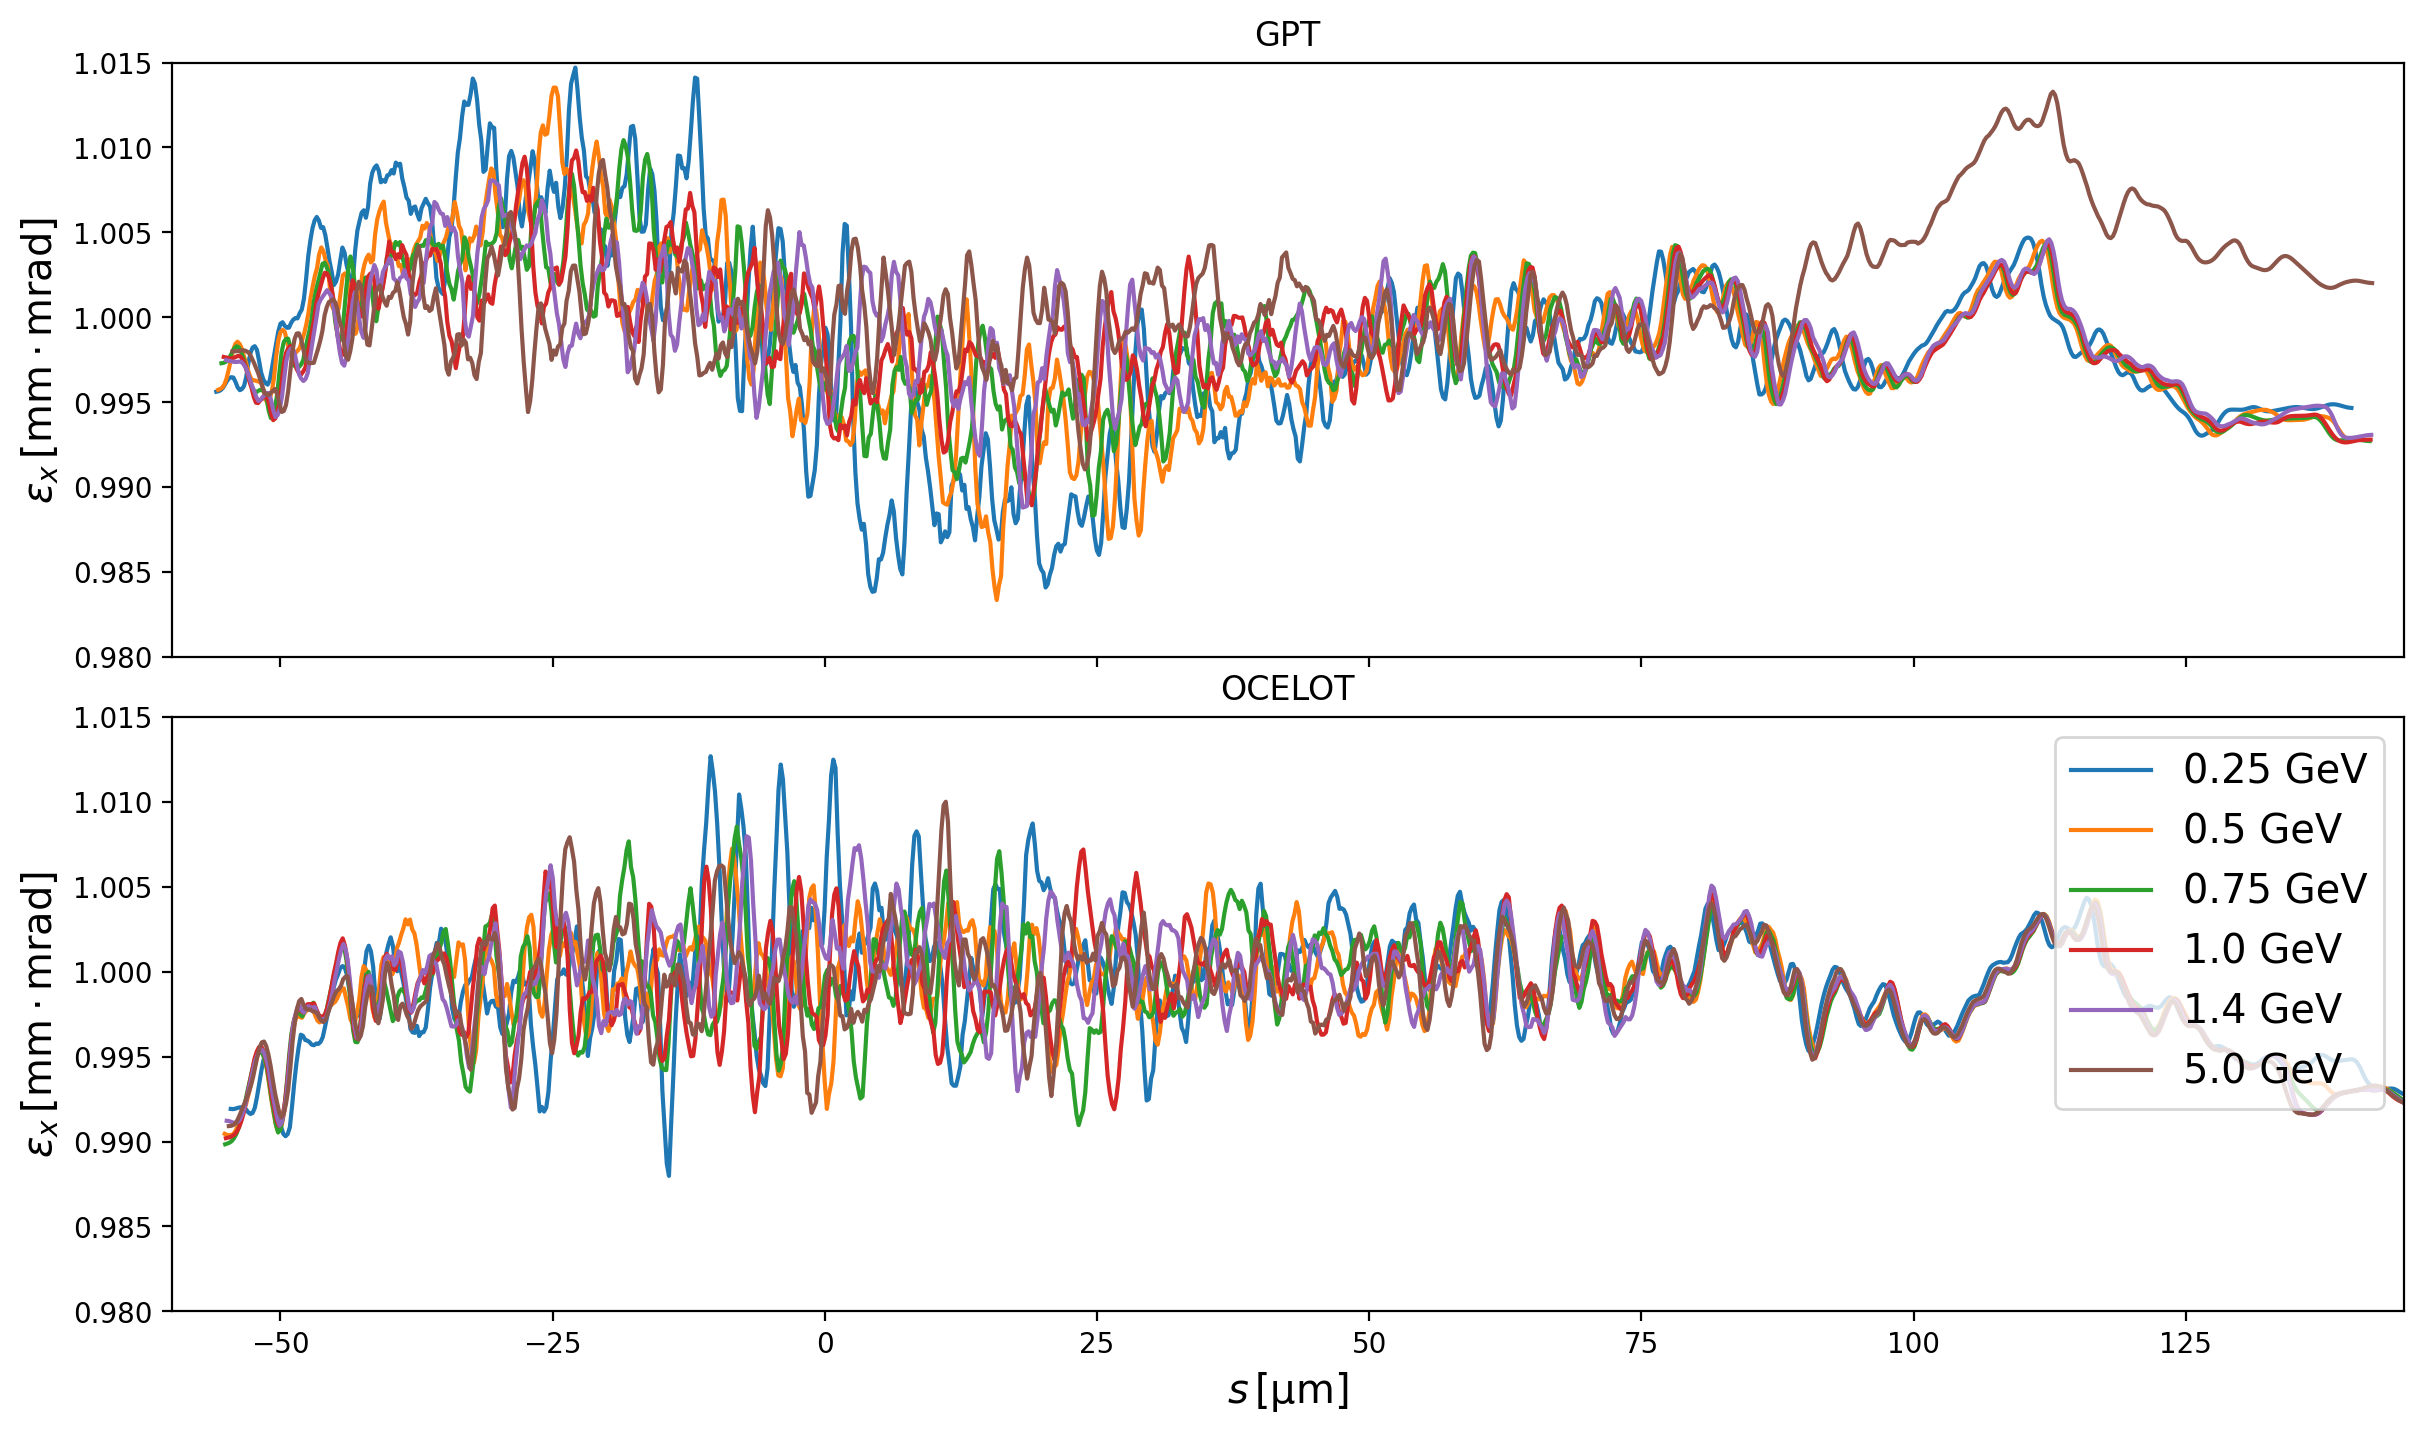
Fig. 15 Slice emittances at the end of the Zeuthen benchmark chicane in GPT using just the radiative term (no Coulomb) of the Liénard-Wiechert potential for a range of beam energies at a bunch charge of 100pC.
Conclusion
GPT shows a number of interesting behaviours which are dependent on the energy and bunch charge. At large energies the tail sees a particularly drastic increase in the slice emittance, but as this region of phase space is relatively sparse, it does not necessarily matter much. However the decrease in the slice emittance in the region of phase space corresponding to the current spike is consistently demonstrated using GPT and is absent from the 2D (CSRTrack) and 1D (OCELOT and CSRTrack) models. If indeed the beam can be cooled, with greater cooling at larger energies and bunch charges, then this is an interesting departure from pre-existing simulations and should be understood and perhaps measured in one of the existing facilities. One possible source of the difference in the calculation include the energy-dependence of the model (OCELOT assumes γ → ∞, but GPT does not make such an ultra-relativistic assumption), another is the handling of the singularity in the Liénard-Wiechert potential.
- 1d-underestimate