Cheetah image viewer - cxiview
cxiview is a standalone image viewer for displaying data saved in .cxi files output from Cheetah. Desgned for use with modern segmented detectors, geometry is applied on-the-fly from either Cheetah pixelmap or CrystFEL geometry files.
cxiview can display 2D image data from almost any HDF5 file and can be run completely independently of the Cheetah GUI if desired. It is used for reviewing data quality, checking peak finding performance, finding bad regions, overlaying mask information, and anything else where looking at 2D image data is useful. It is used to display not only CXI files but also the powder patterns and masks and is an ideal replacement for hdfsee.
The GUI calls cxiview from the command line directly as follows:
> cxiview.py -g ../calib/geometry/current-geometry.geom -e /entry_1/data_1/data -i ../hdf5//r0059-ps2/*.cxi
cxiview can be used independenly of the Cheetah GUI using similar syntax from the command line. cxiview is written in python and can be installed separately from the Cheetah data processing modules: See the Cheetah at home page for instructions.
Command line options
> cxiview.py -g ../calib/geometry/current-geometry.geom -e /entry_1/data_1/data -i ../hdf5//r0059-ps2/*.cxi
> cxiview -h
Using /reg/g/cfel/cheetah/cheetah-stable
usage: cxiview.py [-h] [-g G] [-i I] [-e E] [-z Z] [-v V] [-l L] [-p P] [-s S]
CFEL CXI file viewer
optional arguments:
-h, --help show this help message and exit
-g G Geometry file (.geom/.h5)
-i I Input file pattern (eg: *.cxi, LCLS*.h5)
-e E HDF5 field to read
-z Z Detector distance (m)
-v V Photon energy (eV)
-l L Read event list
-p P Circle peaks by default
-s S CrystFEL stream file. If the stream file is passed to the
program all other options except -e are ignored. The relevant
information is generated automatically from the stream file.
Useful features
FIle formats
SIngle-frame HDF5 files, .cxi files, powder patterns, and many more. Should extend to include CBF, TIFF and other formats in the near future.
Display any HDF5 field
Use the -e option to specify which HDF5 field to display.
The file pattern specified using -i gets expanded using glob, so you can recursively search for files matching a pattern and display them all at one time. An internal event list is generated as the file list is expanded.
Geometry files
Geometry is applied on-the-fly, so a geometry file is recommended. If not present data will be displayed in ‘raw’ layout as arranged in memory, which may or may not resemble the layout in real space. The program is easily adapted to any detector where geometry should be applied to the data before display, for example using a pixelmap lookup table.
Geometry files can be provided as either Cheetah-style pixelmap files (.h5), or CrystFEL style Geometry files (.geom)*.
-
*Since the geometry reader is written in Python, not using the libCrystFEL interface, it may drift out of date over time.
Stream files
cxiview can display CrystFEL stream files provided the image data is available
> cxiview -s mystream.stream
This enables found and predicted peaks to be overlaid and displayed, alongside the data masks for bad regions. Very useful for verifying that your indexing results make sense. See below.
Resolution rings
Can be drawn on the image. However there is a ‘do not lie’ mode: resolution rings will not be drawn unless sufficient information is provided to draw them accurately. This is to avoid accidentally misleading you into getting excited about a fantastic 0.5Å pattern when in fact it should have been 10Å but with the wrong detector distance used, for example.
Masks
Display the bad pixel and other masks saved with data by Cheetah. Overlaid in semi-transparent red.
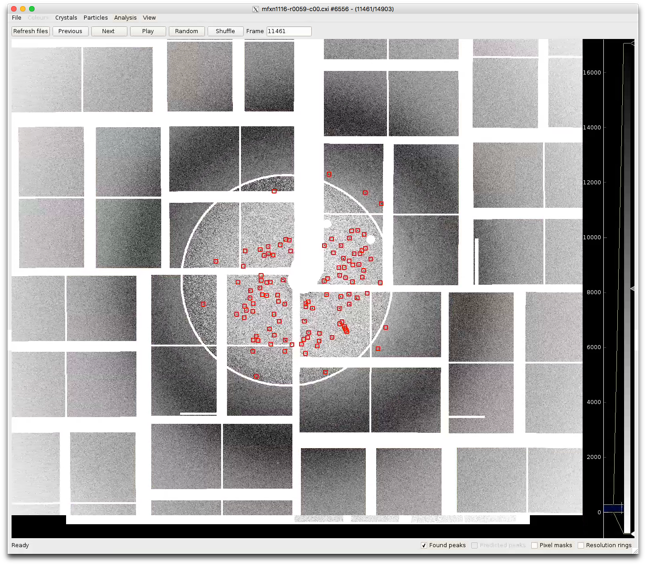
Display found peaks
Check this box to circle peaks found by Cheetah (if present). VERY useful for making sure peak finding is working properly. Use this option and look at your data.
Display predicted peaks
Overlay peaks predicted by CrystFEL indexing. Only works when a stream file is provided, but very useful for verifying that predicted peaks match the diffraction pattern acceptably. cxiview can replace hdfsee for this purpose.
This program is continually expanding since viewer programs tend to grow additional functionality over time. Check whether there are more options available. Being standalone and open source you can expand it too - independently of the rest of Cheetah. cxiview is written in python 3.5 with Qt5 for the GUI and pyqtgraph for fast image display, and is found in the python/ directory of the Git repository.
For those who wish to re-use cxiview elsewhere, cxiview from the command line actually calls the following script so as to use the correct dependencies without affecting your global environment variables.
Modify to suit:
> less cxiview
#!/bin/bash
CDIR=/reg/g/cfel/cheetah/cheetah-stable
CDEPDIR=/reg/g/cfel/dependencies
ADIR=/reg/g/cfel/anaconda
echo Using ${CDIR}
export PYTHONPATH=""
export PATH=${CDIR}/bin:${ADIR}/bin:${CDIR}/python:$PATH
/reg/g/cfel/cheetah/cheetah-latest/python/cxiview.py $@
Extendable and reusable
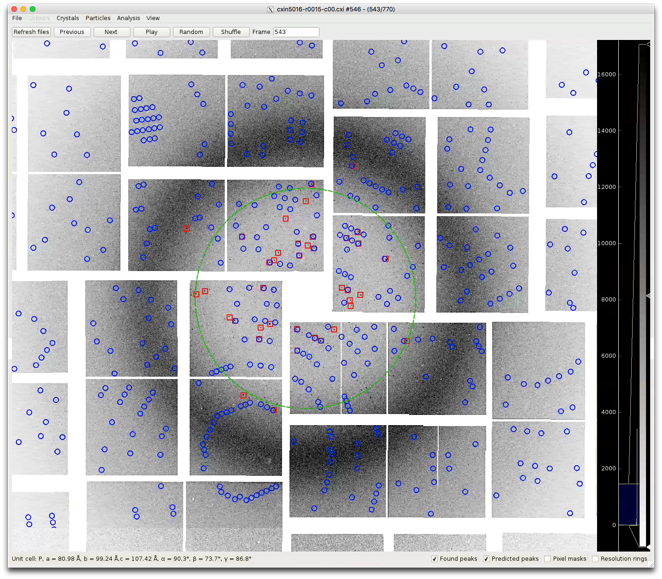
stream files
Very useful for verifying that your indexing results make sense. Enables found and predicted peaks to be overlaid and displayed, alongside the data masks for bad regions. Red squares are found pixels. Blue circles are predictred peaks. Green ring is the resolution of this pattern estimated by CrystFEL. Masks can be highlighted in red overlay. Unit cell parameters for this indexing solution are printed at the bottom.
Syntax is to provide a stream file, which contains all necessary information (including geometry)
> cxiview -s mystream.stream