The most prominent measurement of heavy quark production
is the measurement of the structure functions
![]() and
and
![]() . The HERA-I results were presented in
section 6.1.2 and
6.2.2. Towards large values of
. The HERA-I results were presented in
section 6.1.2 and
6.2.2. Towards large values of ![]() and low values of
and low values of ![]() the charm results are largely limited by statistical uncertainties
while the beauty results are statistically limited everywhere.
With the expected increase of integrated luminosity
to a value of 500 pb
the charm results are largely limited by statistical uncertainties
while the beauty results are statistically limited everywhere.
With the expected increase of integrated luminosity
to a value of 500 pb ![]() obtained in HERA-II the experimental
errors are expected to shrink significantly, such that the data
can provide useful constraints for global fits.
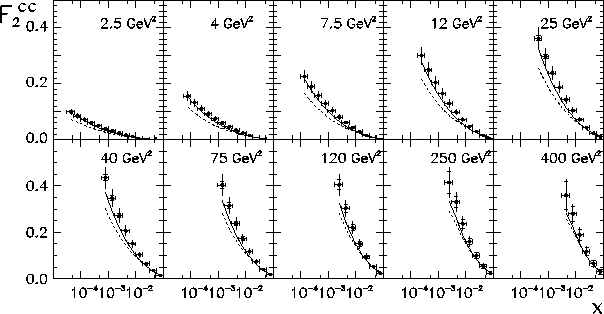
In fig.58 the expectation for the
measurement of
obtained in HERA-II the experimental
errors are expected to shrink significantly, such that the data
can provide useful constraints for global fits.
In fig.58 the expectation for the
measurement of
![]() using an integrated luminosity
of 200 pb
using an integrated luminosity
of 200 pb![]() is shown.
The central values of the expectation are based on an
H1 measurement of the gluon density from
is shown.
The central values of the expectation are based on an
H1 measurement of the gluon density from ![]() evolution
studies of the inclusive proton structure function
evolution
studies of the inclusive proton structure function ![]() in next-to-leading order QCD, such as reported in [66].
The overall average precision is 10%
and is systematically limited at
low
in next-to-leading order QCD, such as reported in [66].
The overall average precision is 10%
and is systematically limited at
low ![]() and statistically limited at high
and statistically limited at high ![]() .
Different methods for charm and beauty tagging have been established
in HERA-I which are explained in section 5, i.e. the use of reconstructed
.
Different methods for charm and beauty tagging have been established
in HERA-I which are explained in section 5, i.e. the use of reconstructed
![]() mesons[2,3,4,5,57,7,8,58,9,11,12,13,14,15,16,55,17,56,18,21,19,23,24,25,26],
the use of semi-leptonic decays [36,37,38,39,40,41,42]
and the use of lifetime tags made possible by the use
of silicon vertex detectors [6,44,43,45,46],
providing superior
spatial resolution close to the interaction region.
For HERA-II a combination of these methods will help to further
reduce the systematic
and theoretical uncertainties to the level of few percent.
mesons[2,3,4,5,57,7,8,58,9,11,12,13,14,15,16,55,17,56,18,21,19,23,24,25,26],
the use of semi-leptonic decays [36,37,38,39,40,41,42]
and the use of lifetime tags made possible by the use
of silicon vertex detectors [6,44,43,45,46],
providing superior
spatial resolution close to the interaction region.
For HERA-II a combination of these methods will help to further
reduce the systematic
and theoretical uncertainties to the level of few percent.
 |