


| Combined Xi vs. Number of Particles Plots with and without high xi values. | |
|
|
|
| ABCD for 4 layer detector for 1.0J laser and 17.5GeV (TRIDENT) - Particles have way less energy, therefore bigger losses for smaller detector (c1,c2) | |
|
|
|
| e- (left) and e+ (right) in first layer for 1.0J laser and 17.5GeV (TRIDENT) | |
|
|
|
| hitmap for e+(left of 0) and e+ (right of 0) 1J, 17.5 GeV (TRIDENT) | |
|
| |
| money plot for e+ 1J, 17.5 GeV (TRIDENT) | |
|
| |
| x and y distributions | |
|---|---|
| Positron x and y distributions in first detector layer for 14 GeV produced | |

|

|
| 27.06.19 | |
| Additional requested plots | |
| Electron and Positron Energy Distribution for 14 GeV produced | |

|

|
| Electron and Positron Energy Distribution for 14 GeV in Detector | |

|

|
| Electron and Positron Energy Distribution for 17.5 GeV produced | |

|

|
| Electron and Positron Energy Distribution for 17.5 GeV in Detector | |

|

|
| Hitmap in first detector layer for 14 GeV (left) and 17.5 GeV (right) | |

|

|
| Particle Energy vs. Position plots | |

|

|
| 25.06.19 | |
|---|---|
| Some thoughts on this plots: Der Yield bei 14 GeV ist sehr viel niedriger als bei 17.5. Etwa 2 orders of magnitude. Laesst sich aber durch mehr statistik auffangen, das verhalten bei steigendem Xi ist zumindest im simulierten Detector von der gleichen Shape. Der Unterschied zwischen einem und zwei Staves ist wirklich marginal. Der zweite Stave faengt wirklich nur den aussersten Tail von low energy Positronen ein, und bringt eine verbesserung im promille-bereich (vergleiche C1 und C2), von daher scheint es mir sinnvoll, darueber nachzudenken, wirklich nur ein stave auf jeder seite pro tracking layer zu verwenden. | |
| ABCD for 17.5 GeV, C includes hitting first and 4th plane of the tracker | |

|

|
A: 53.793 Effizienz: 1
B: 53.793 Effizienz: 1
C1: 53.3147 Effizienz: 0.991109
C2: 53.791 Effizienz: 0.999963
D1: 53.29 Effizienz: 0.990649
D2: 53.731 Effizienz: 0.998847
| ABCD for 14 GeV, C includes hitting first and 4th plane of the tracker | |

|

|
A: 0.694336 Effizienz: 1
B: 0.694336 Effizienz: 1
C1: 0.689754 Effizienz: 0.993401
C2: 0.694256 Effizienz: 0.999884
D1: 0.68953 Effizienz: 0.993078
D2: 0.69312 Effizienz: 0.998248
| Yields for different Xi values. Nominal Xi. | |

|

|
| 5.02.18 | |
|---|---|
| Finalized the new LaserPower vs. Particle Number Plots for 5m and 12m | |

|

|
| 6.02.18 | |
|---|---|
| Relevant sources of uncertainties for electron number measurement in order of implementation: | |
| Occupancy (more than 1 electron/pixel) | |
| Pixel size / resolution (take middle of each pitch/bin for energy reco) | |
| Overlap at Pixel border | |
| Pixel Efficiency (expected to be close to 100%) | |
| 7.02.18 | |
|---|---|
| Energy vs. x position in Detector. Somehow this shape is strange. will have to look into it next week. | |

| |
| 11.02.18 | |
|---|---|
|
producing files according to meeting. | |
Energy of Positrons 5m
|
Energy of Positrons 12m
|
|
average Particles in the Detector 5m Der leichte Anstieg von rechts nach links ist weiterhin vorhanden. 
|
average Particles in the Detector 12m
|
| 13.02.18 | |
|---|---|
|
Energy X distribution profiles (plot from 07.02.18)
Something unphysical is going on here | |
|
Profile if x vs.Energy plot X-Axis: Deflection | Y-Axis: Energy 
|
Profile if x vs.Energy plot with exchanged axis X-Axis: Energy | Y-Axis: Deflection this shows better the drop off at high energies. if this where true, 16 GeV positrons would be deflected more than 10 GeV 
|
| 15.02.18 | |
|---|---|
|
Comparison to same plots done with old code. could no isolate the problem in any physical property, code comparison done, searching for mistake and if it only affects this plot or all other plots too | |
old code
|
actual code version
|
| 21.02.18 | |
|---|---|
|
Update on the position issue: Bug has been found, see below, now it looks fine. Was a special case for the magnet used in the polarimeter. |
|
Electrons for 1 Joule Laser Energy: 
|
positrons for 1 Joule Laser Energy:
|
| 07.03.19 | |
|---|---|
|
New "Money Plots" including different energy bins |
|
Comparison of 5m and 12m
|
5m inluding different energy bins
|
| 12m inluding different energy bins
|
|
| 9.04.19 | |
|---|---|
|
ABCD sceme is working |
   N_pos
A: 4.781 Effizienz: 1
B: 4.767 Effizienz: 0.997072
C: 4.767 Effizienz: 0.997072
D: (1000000x150000) 0.989 Effizienz: 0.206861 (genau 1 pixel)
D: (10000x10000) 4.274 Effizienz: 0.893956
D: (1000x1000) 4.72 Effizienz: 0.987241
D: (100x100) 4.762 Effizienz: 0.996026
D: (50x50) 4.765 Effizienz: 0.996654
D: (50x500) 4.765 Effizienz: 0.996654
Beispiel2: 5m Laser to IP,1.0J Laser 1.4T, 1m drift, Detector 1m x 0.15m, Pixelgrosse in um. (maximaler Teilchenfluss in Sim momentan)
	N_pos
A: 24.52 Effizienz: 1
B: 24.185 Effizienz: 0.986338
C: 24.185 Effizienz: 0.986338
D: (1000000x150000) 1 Effizienz: 0.0407831 (genau 1 pixel)
D: (10000x10000) 19.794 Effizienz: 0.80726
D: (1000x1000) 23.986 Effizienz: 0.978223
D: (100x100) 24.17 Effizienz: 0.985727
D: (50x50) 24.181 Effizienz: 0.986176
D: (50x500) 24.175 Effizienz: 0.985931
| 10.04.19 | |
|---|---|
|
ABCD sceme is working |
|
5m Laser-IP;1.0J;1.4T;1m drift; Detector 1m x 0.15m Pixelgrosse in um; Alle Pixelpunkte erlauben maximale occupancy von 1 
|
 |
| 28.05.19 | |
|---|---|
|
Plots requested from the Talk |
|
0.35J, 5mFoilIP, Positron Spectrum
|
1.0J, 5mFoilIP, Positron Spectrum |
0.35J, 5mFoilIP, Time Distribution
|
1.0J, 5mFoilIP, Time Distribution |
0.35J, 5mFoilIP, Electron and Positron Spectrum
|
1.0J, 5mFoilIP, Electron and Positron Spectrum |
0.35J, 5mFoilIP, XI distribution 0.35
|
1.0J, 5mFoilIP, XI distribution 1.0 |
0.35J, 5mFoilIP, Xi vs time 0.35
|
1.0J, 5mFoilIP,XI vs. time 1.0 |
Money Plot. Nominal and Mean Xi for 8m LaserIP Distance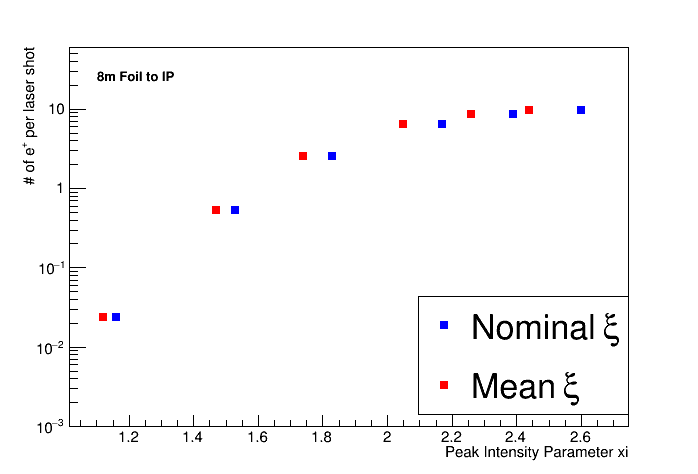
|
Money Plot, only for 8m, with Nominal Xi.  |