
URL: https://www.desy.de/information__services/press/press_releases/2011/pr_191211/index_eng.html
Breadcrumb Navigation
Fastest X-ray images of tiny biological crystals
")
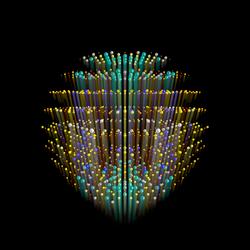
The molecular structure of proteins is inferred by measurements of patterns of X-rays scattered from crystals formed from those proteins. The regular array of molecules in the crystal gives rise to strong peaks needed for measurement, shown here as balls in a three-dimensional space. The size and color of each ball represents the strength of diffraction, which encodes the three-dimensional molecular structure of the protein. Ultra-intense X-rays from a free-electron laser causes the crystal to explode, but not before high-quality data can be recorded. The paper from Barty et al shows that the explosion simply causes these diffraction peaks to terminate, without compromising the quality of data. The streaks emanating from each diffraction peak represent the time that the peak accumulates at the detector, with the high angle peaks (which encode high-resolution structural data) turning off first. Credit: Thomas White, CFEL/DESY
Protein Nanocrystals Form a Time Switch for Diffraction
Hamburg, 19 Dezember. An international research team headed by DESY scientists from the Center for Free-Electron Laser Science (CFEL) in Hamburg, Germany, has recorded the shortest X-ray exposure of a protein crystal ever achieved. The incredible brief exposure time of 0.000 000 000 000 03 seconds (30 femtoseconds) opens up new possibilities for imaging molecular processes with X-rays. This is of particular interest to biologists, but can be employed in many fields, explain lead authors Dr. Anton Barty and Prof. Henry Chapman from the German accelerator centre Deutsches Elektronen-Synchrotron DESY. CFEL is a joint venture of DESY, the Max Planck Society and the University of Hamburg.
see press release
Contacts:
Prof. Henry Chapman, CFEL,
+49 40 8998-94155
henry.chapman@desy.de
Dr. Anton Barty, CFEL,
anton.barty@desy.de
Dr. Thomas Zoufal, DESY Press Officer
+49 40 8998-1666
thomas.zoufal@desy.de
")
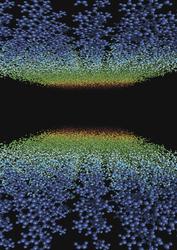
The molecular structure of proteins is inferred by X-ray diffraction from crystals composed of building blocks of identical protein molecules. This image shows the amount of atomic disordering that occurs in such a protein crystal when illuminated by an ultra-intense pulse from an X-ray free-electron laser. The disordering increases with time (depicted by colour changing from blue to red). The crystal becomes an amorphous soup of atoms by the end of the pulse, which no longer gives strong diffraction peaks. The diffraction peaks at high resolution turn off early in the pulse, whereas low-resolution diffraction lasts longer. Even if pulses are much longer than the explosion timescale, the measurement corresponds to the undamaged molecule. Credit: Carl Caleman and Anton Barty, CFEL/DESY |
")
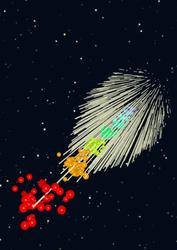
Under illumination from an ultra-intense X-ray pulse from an X-ray free-electron laser, a small molecule is ionized and explodes due to the Coulomb repulsion of the ions. The temperature of the ions (proportional their velocity distribution) also increases with time, indicated by as colours from blue to red. Crystalline samples of such molecules explode in a similar fashion. These crystals diffract the X-rays to give Bragg peaks shown in the background, from which the molecular structure is determined. During the explosion the atomic disordering turns off these Bragg peaks so that the diffracted X-ray spots reaching the detector are of shorter duration than the impinging pulse. The high-angle diffraction turns off first (short streaks) whereas the low-angle (and low resolution) diffraction peaks last longer (long streaks). Even if pulses are much longer than the explosion timescale, the measurement corresponds to the undamaged molecule. Credit: Jörg Harms, MPSD/University of Hamburg |
")
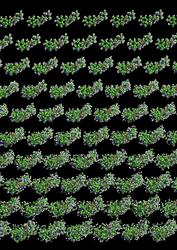
A protein crystal consists of a regularly ordered array of protein molecules. The molecular structure is determined from the pattern of X-ray light (called a diffraction pattern) that is scattered from this periodic array. Unider illumination from an ultra-intense X-ray pulse from a free-electron laser the crystal explodes. This initiates as an atomic disordering of all the constituent molecules. As this disorder increases in time (which flows down the picture) the crystal loses definition initially at the highest resolution, and later at lower resolution, causing a corresponding termination of the detected diffraction. Even if pulses are much longer than the explosion timescale, the measurement corresponds to the undamaged molecule. Credit: Carl Caleman, CFEL/DESY |
Animation of atomic displacement in a lysergic diethylamide crystal in an XFEL beam. Displacement based on a plasma simulation. Photon pulse: 2keV photons, 1017 W/cm2, 70fs flat top. Credit: Carl Caleman, CFEL/DESY

")
A plot of the relative efficiency of Bragg diffraction peaks is shown as a function of resolution for a range of pulse durations. As the X-ray pulse is increased from 70 fs to 300 fs, the high resolution peaks seem to contribute less counts to the pattern. This is because the peaks turn off after about 30 fs and and only the first part of the pulse contributes. The dashed lines show the predicted contribution, using a plasma physics model of the exploding protein crystal. Credit: Anton Barty, CFEL/DESY