PROTON STRUCTURE
QCD Fit HERAPDF1.5:
H1prelim-10-142, ZEUS-prel-10-018Part of the HERA II data has been combined (H1-prelim-10-141,ZEUS-prel-10-017). The PDF set HERAPDF1.5 represents the QCD analysis of the combined HERA I including the preliminary combination of the HERA II data. Such, higher precision at high Q2 and high x is achieved. The precision of the PDFs at high x is significantly improved, particularly in the valence sector.
(1) HERAPDF1.5, Q2=2 GeV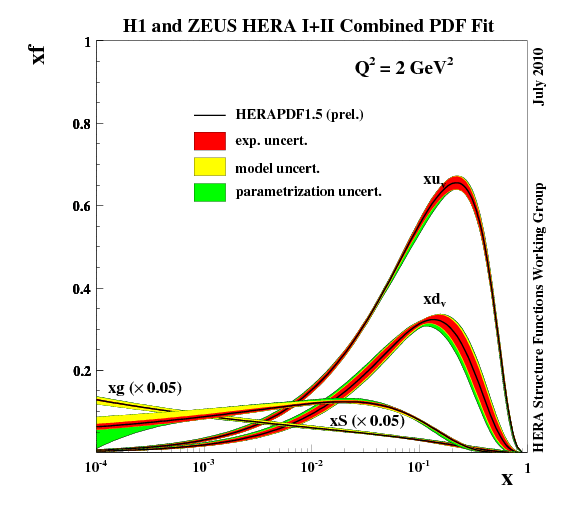
HERAPDF1.5, Q2=2 GeV
(2) HERAPDF1.5, Q2=10GeV2
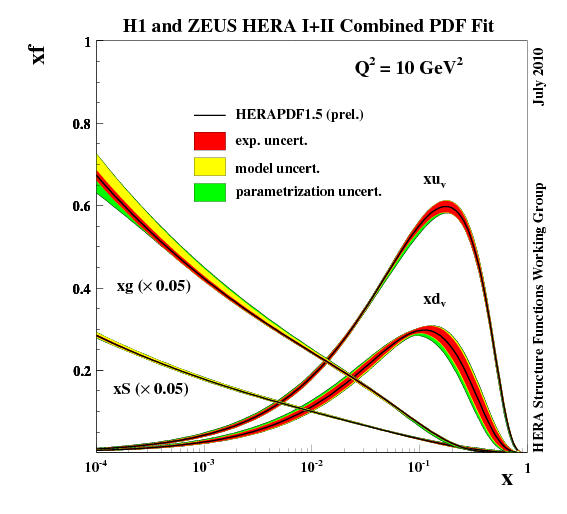
HERAPDF1.5, Q2=10GeV2
(3) HERAPDF1.5, Q2=10000GeV2
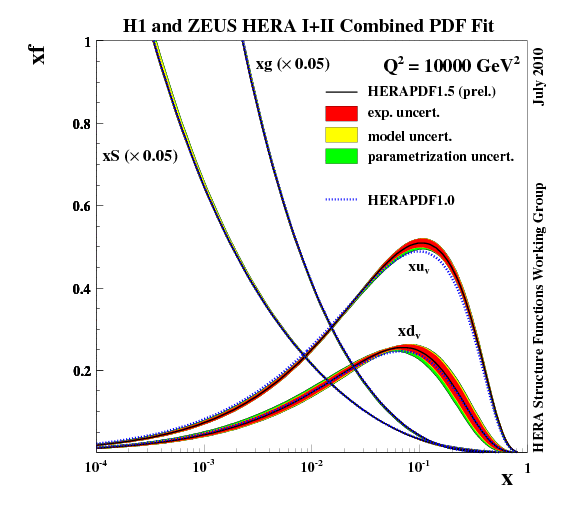
HERAPDF1.5, Q2=10000GeV2
(4) HERAPDF1.0, Q2=2GeV2

HERAPDF1.0, Q2=2GeV2
(5) HERAPDF1.0, Q2=10GeV2
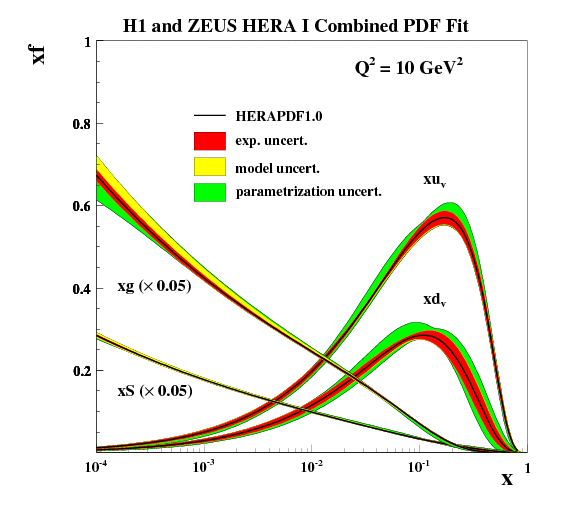
HERAPDF1.0, Q2=10GeV2
(6) HERAPDF1.0, Q2=10000GeV2
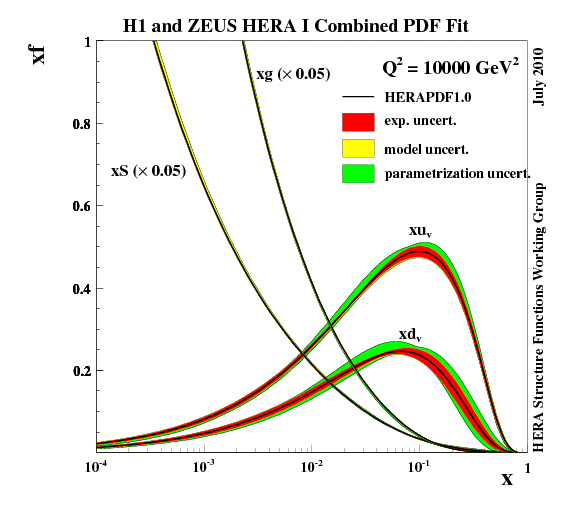
HERAPDF1.0, Q2=10000GeV2
(7) HERAPDF1.5, Q2=2 GeV2, linx scale
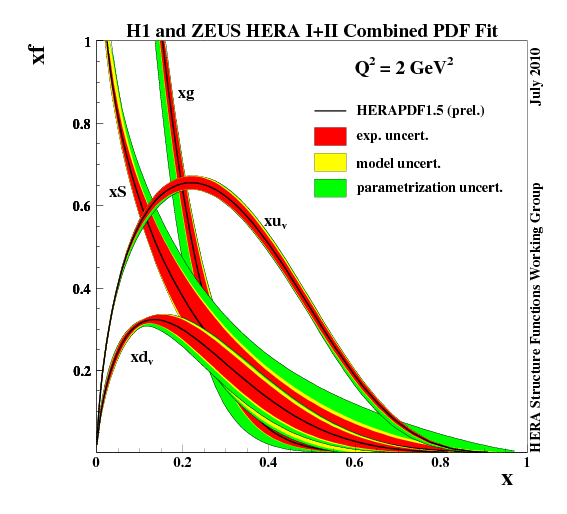
HERAPDF1.5, Q2=2 GeV2, linx scale
(8) HERAPDF1.5, Q2=10 GeV, linx scale
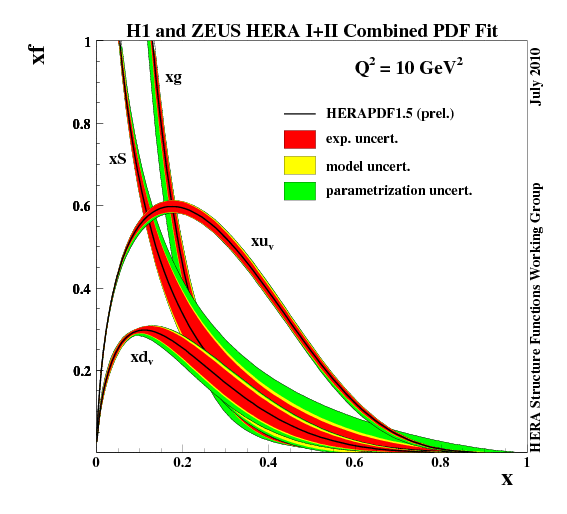
HERAPDF1.5, Q2=10 GeV, linx scale
(9) HERAPDF1.5, Q2=10000 GeV, linx scale
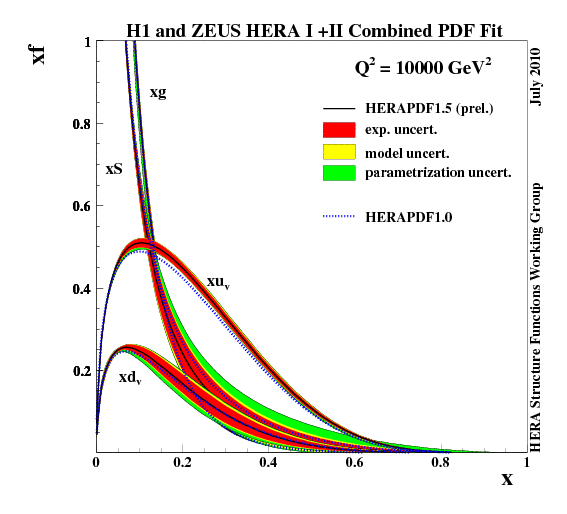
HERAPDF1.5, Q2=10000 GeV, linx scale
(10) HERAPDF1.0, Q2=2 GeV2, linx scale
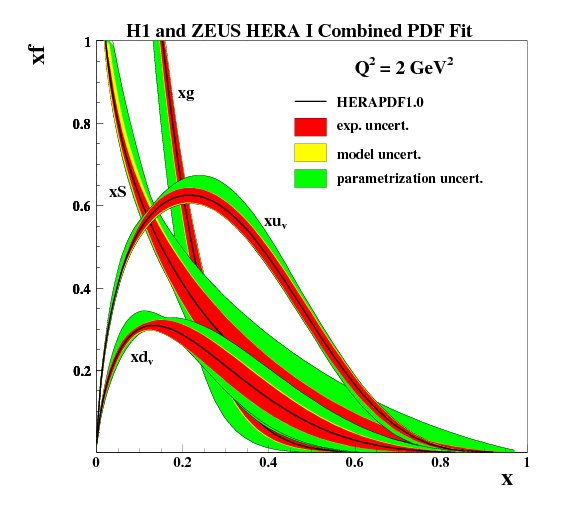
HERAPDF1.0, Q2=2 GeV2, linx scale
(11) HERAPDF1.0, Q2=10 GeV2, linx scale
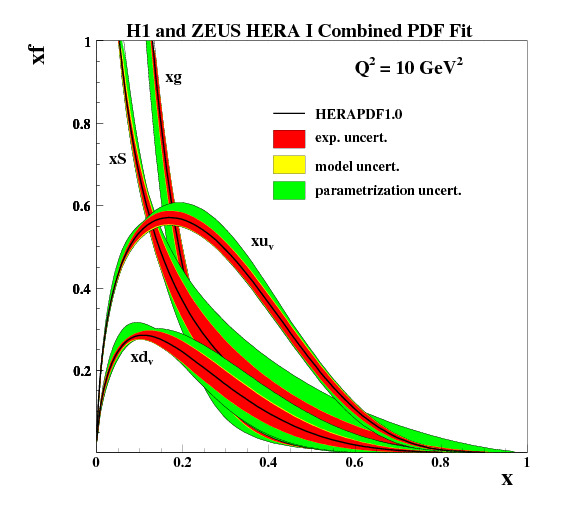
HERAPDF1.0, Q2=10 GeV2, linx scale
(12) HERAPDF1.0, Q2=10000 GeV2, linx scale
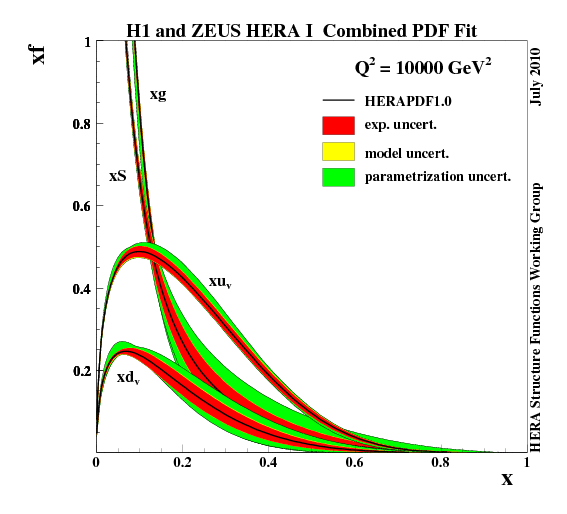
HERAPDF1.0, Q2=10000 GeV2, linx scale
(13) HERAPDF1.5 vs HERAPDF1.0 Q2=2GeV2 linx scale
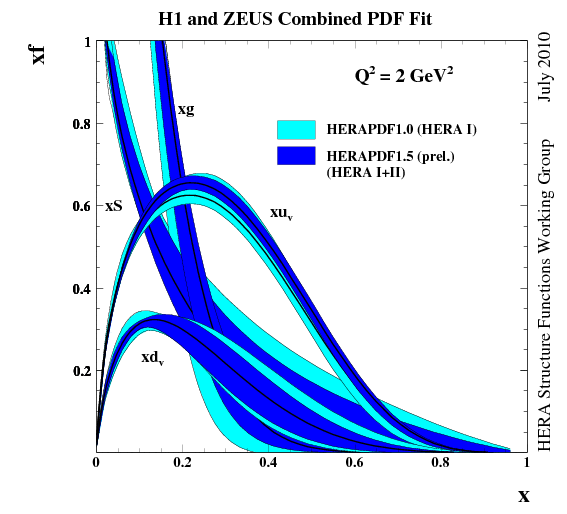
HERAPDF1.5 vs HERAPDF1.0 Q2=2GeV2 linx scale
(14) HERAPDF1.5 vs HERAPDF1.0 Q2=10GeV2 linx scale
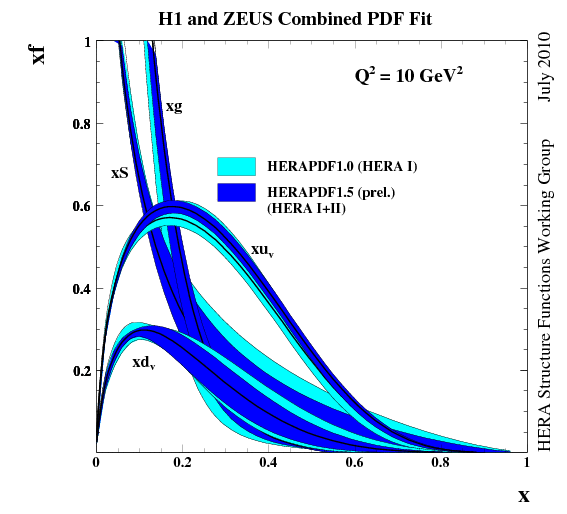
HERAPDF1.5 vs HERAPDF1.0 Q2=10GeV2 linx scale
(15) HERAPDF1.5 vs HERAPDF1.0 Q2=10000GeV2 linx scale
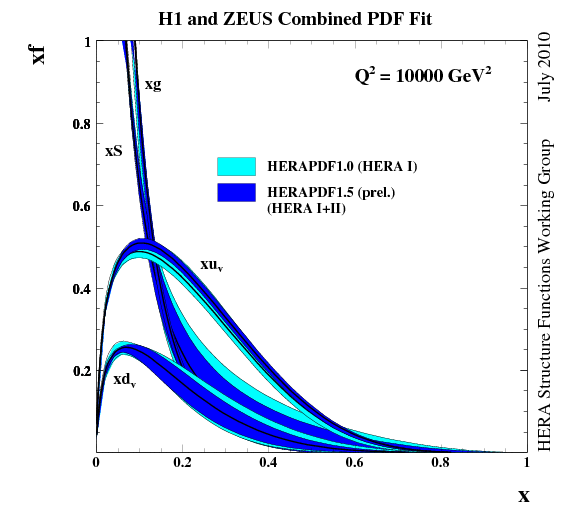
HERAPDF1.5 vs HERAPDF1.0 Q2=10000GeV2 linx scale
(16) Valence distributions and d/u ratios HERAPDF1.5 and HERAPDF1.0 at Q2 of 2 GeV2

Valence distributions and d/u ratios HERAPDF1.5 and HERAPDF1.0 at Q2 of 2 GeV2
(17) Valence distributions and d/u ratios HERAPDF1.5 and HERAPDF1.0 at Q2 of 10 GeV2

Valence distributions and d/u ratios HERAPDF1.5 and HERAPDF1.0 at Q2 of 10 GeV2
(18) Valence distributions and d/u ratios HERAPDF1.5 and HERAPDF1.0 at Q2 of 10000 GeV2

Valence distributions and d/u ratios HERAPDF1.5 and HERAPDF1.0 at Q2 of 10000 GeV2
(19) e-p CC cross section for vs HERAPDF1.5
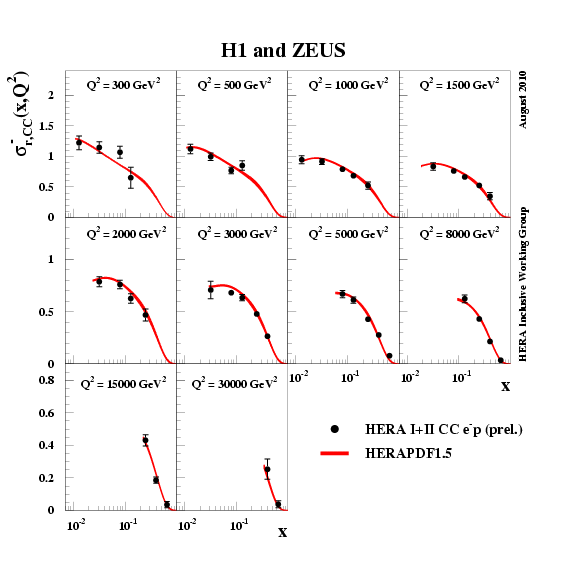
e-p CC cross section for vs HERAPDF1.5
(20) e+p CC cross section for vs HERAPDF1.5
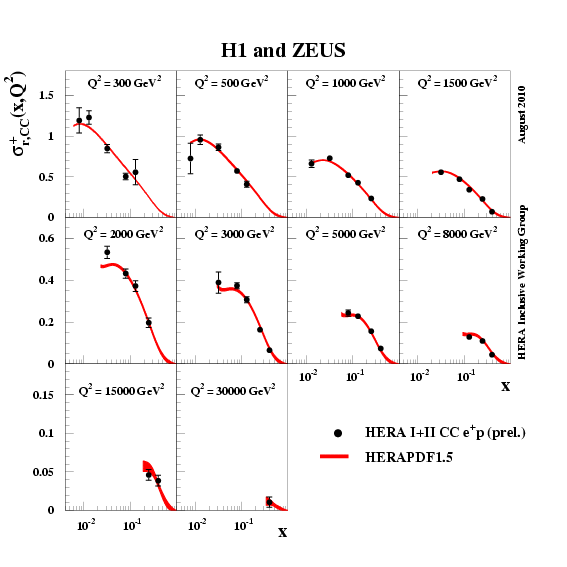
e+p CC cross section for vs HERAPDF1.5
(21) e+p and e-p NC cross section for vs HERAPDF1.5
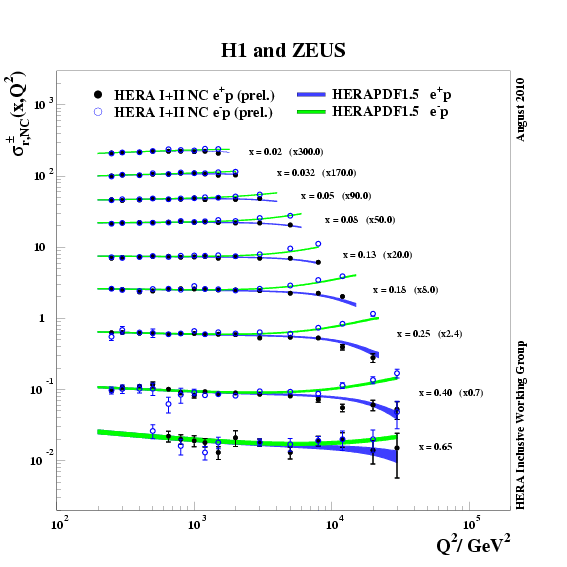
e+p and e-p NC cross section for vs HERAPDF1.5
(22) e-p NC cross section for vs HERAPDF1.5
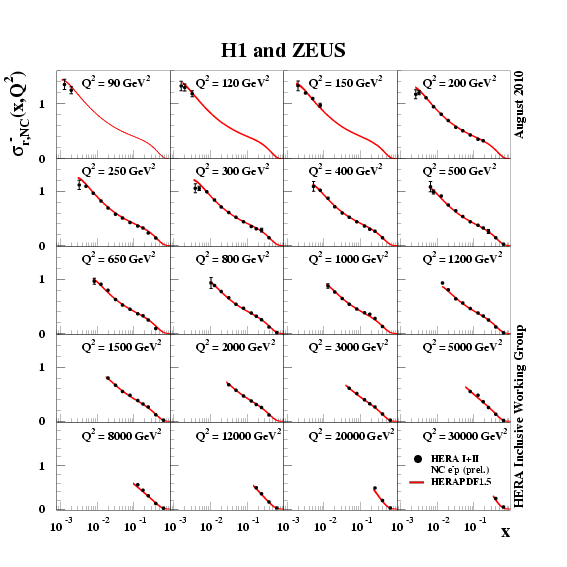
e-p NC cross section for vs HERAPDF1.5
(23) e+p NC cross section for vs HERAPDF1.5 Q2 from 2 GeV2 to 120 GeV2
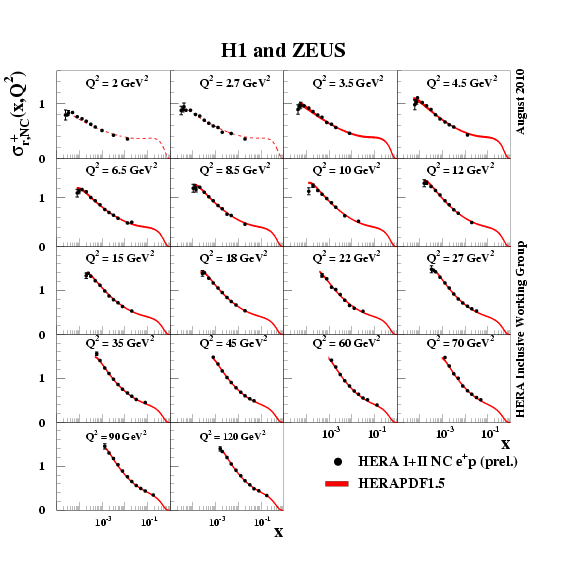
e+p NC cross section for vs HERAPDF1.5 Q2 from 2 GeV2 to 120 GeV2
(24) e+p and e-p NC cross section for vs HERAPDF1.5 Q2 from 150 GeV2 to 30000 GeV2
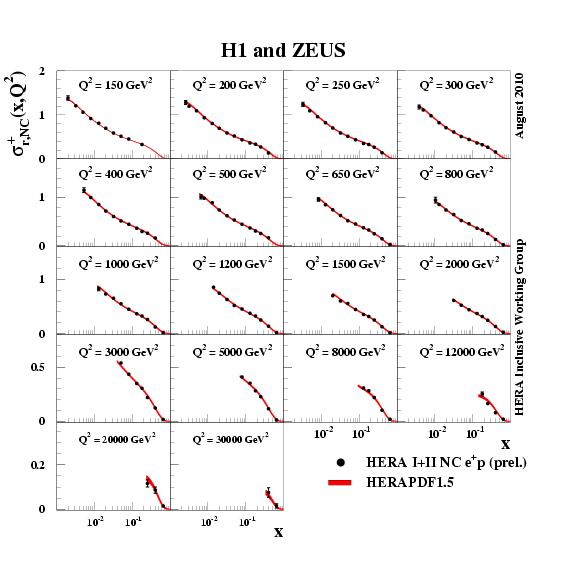
e+p and e-p NC cross section for vs HERAPDF1.5 Q2 from 150 GeV2 to 30000 GeV2
(25) e+p NC cross section for vs HERAPDF1.5 as a function of Q2 for different values of x
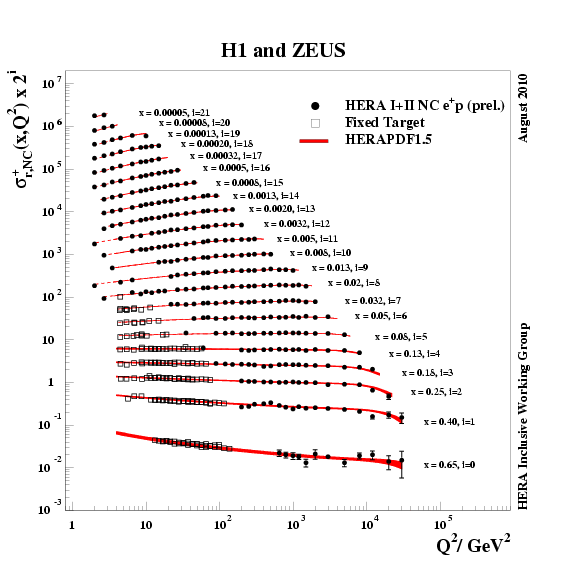
e+p NC cross section for vs HERAPDF1.5 as a function of Q2 for different values of x

